This article provides detailed information about the features available to you within the Alert Logic console's Incident page, found in the Navigation menu (![]() ) at Respond > Incidents.
) at Respond > Incidents.
The Incidents page houses all identified incidents within your deployed environments, as well as access to all details and remediation recommendations for each incident. Individual incident pages include all available information on a given incident, including an investigation report, remediation recommendations, and evidence – comprised of detailed events. Utilize the resources on this page to manage and close incidents to continually secure your environment.
Note: Legacy Cloud Defender customers will see an additional page in the Incident Console not covered below – Incident Summary. This page houses a bubble chart visualizing your environments' incidents by severity and classification or deployment type.
In This Article
Incident List
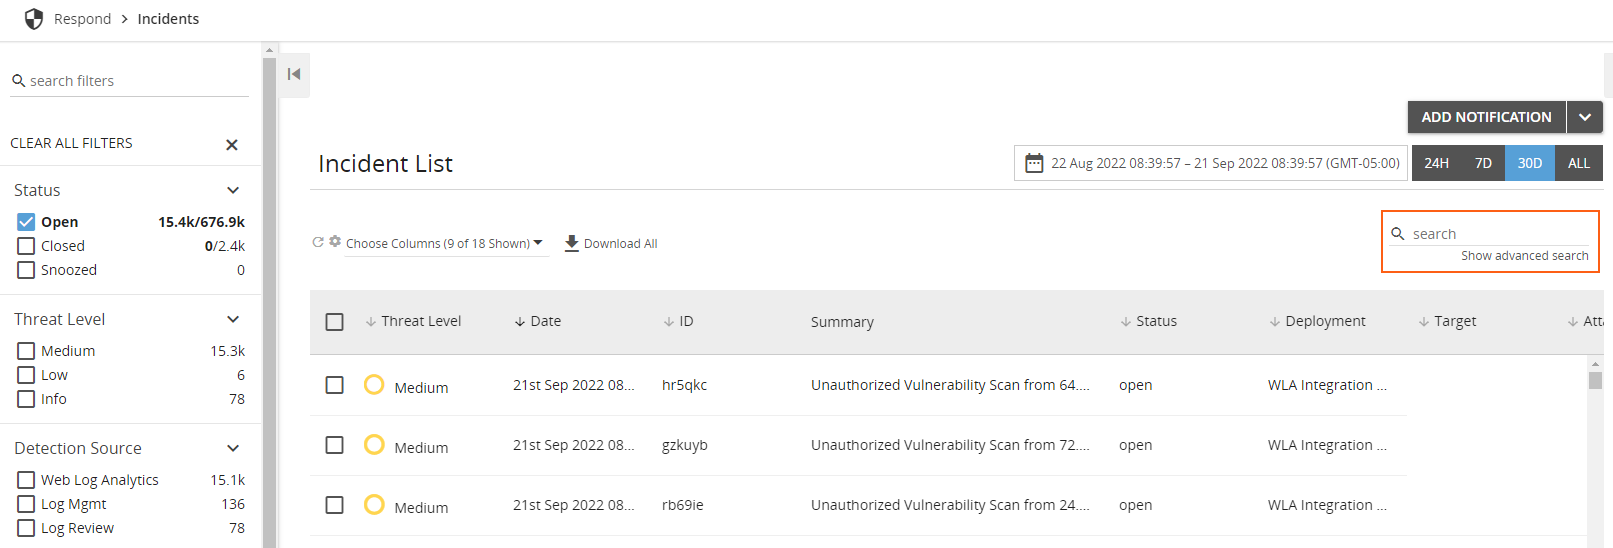
The incident list houses every incident identified within your environment by name and with detailed information. Incidents can be viewed in one of three statuses – Open, Snoozed, and Closed – which you can choose from in the top-left corner of the page.
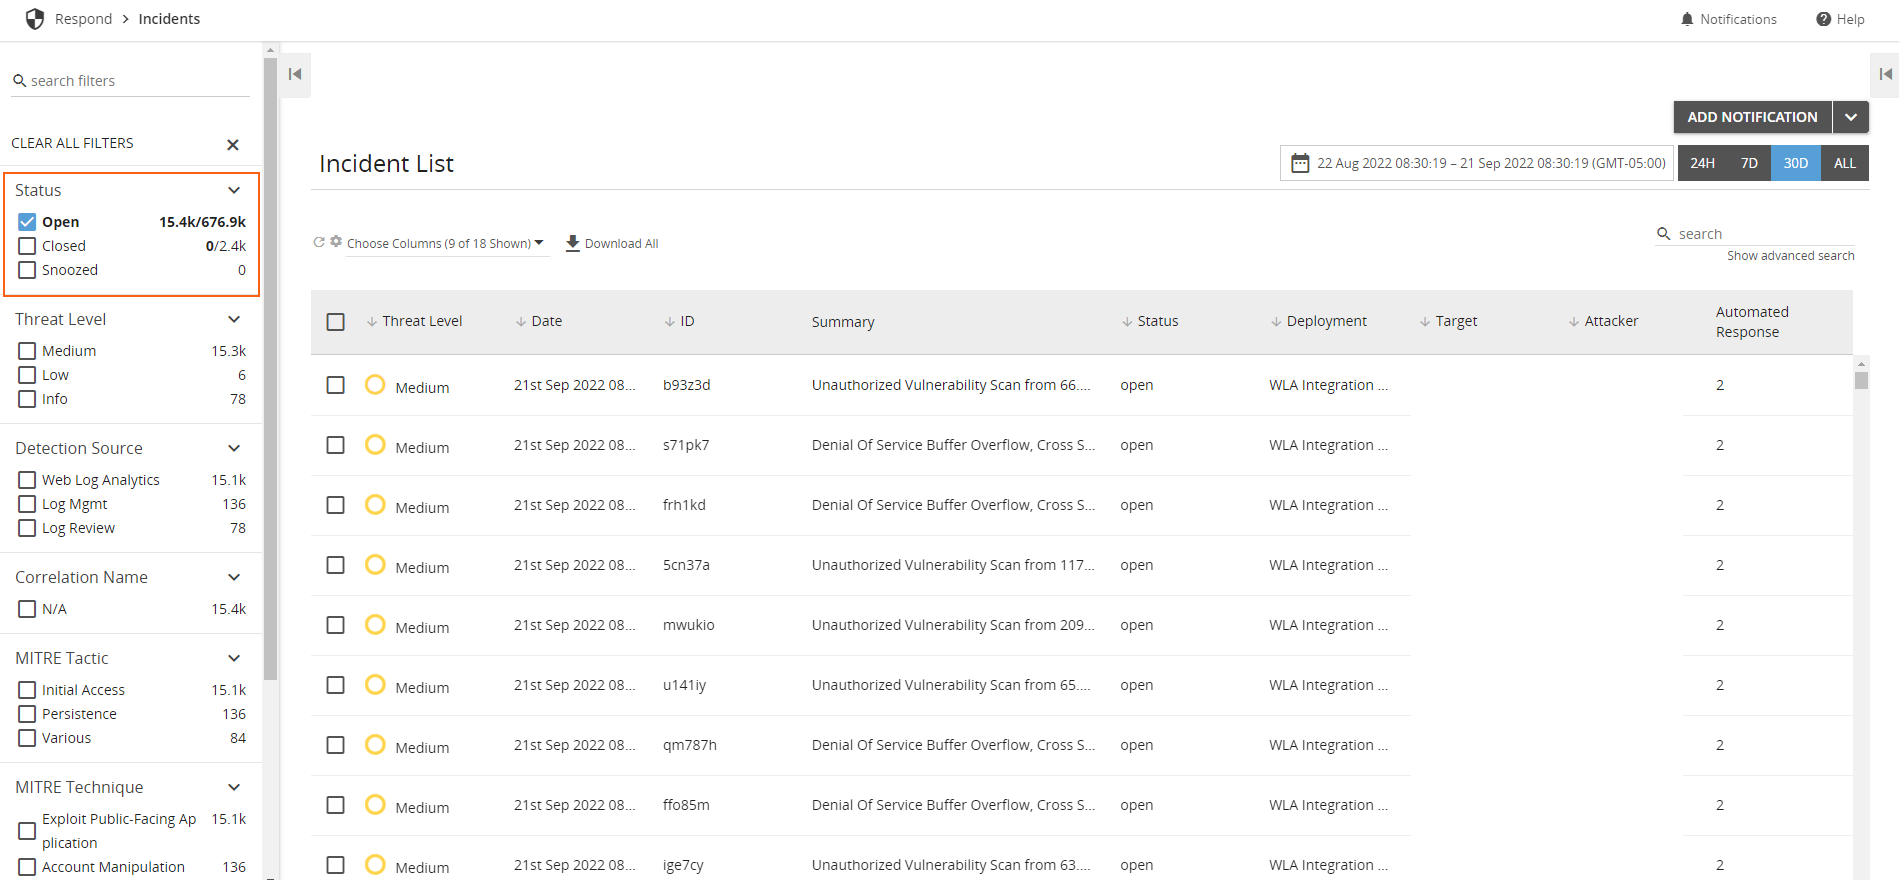
When you've chosen a status, you will see two numbers separated by a slash (ex: 23/37) to the right of the status's title. The number before the slash is the number of incidents within the current status and that are applicable to your current filters. The number behind the slash is the total number of incidents within that status (ex: filtered Snooze incidents/all Snoozed incidents).
Open Incidents
Open incidents are those that have not been snoozed or closed and that need your attention. This does not mean that they have not been acted on, as you have the option to update an open incident without moving it to the Snoozed or Closed statuses.
Snoozed Incidents
Snoozed incidents are those that you have chosen to put on hold for an amount of time that you set. When you snooze an incident, it is temporarily removed from the open incident list. At the end of the amount of time you have set for the snooze, the incident will return to the Open incident list. This status is useful if you are waiting on an outside resource to close the incident or do not have time to continue to remediate but want it removed from your current Open incidents until you can come back to it.
For more information on using the Snooze feature, see the Snooze Incidents section of the Managing Incidents in the Alert Logic Console knowledge base article.
Closed Incidents
Closed incidents are those that you have chosen to mark as complete based on one of several Threat Assessments that you can choose from when closing the incident. When moving an incident to this status, you decide that no more action needs to be taken. Closed incidents can be reopened as needed.
Features
There are several features available to customize your incident list and help you manage your incidents.
Filters
Filter on several properties alongside the Open/Snoozed/Closed statutes, all available in the left-hand panel. These include threat level, classification, detection source, deployment, and Amazon Web Services (AWS) deployment-specific filters. Simply click on one of the choices under the filter classification and your list will reload with that filter applied. These filters are stackable, allowing you to choose one of the filtering options from each classification to drill down into a very specific list of incidents.
Note: To access the AWS deployment-specific filters, click on an AWS deployment at the bottom of the left-hand panel's list of filters.
Incident Preview
Quickly preview an incident's details without leaving the incident list by hovering over the incident; a side panel will appear on the right of your screen with Account, Attacker, Deployment, MITRE Tactic, and other available incident information.
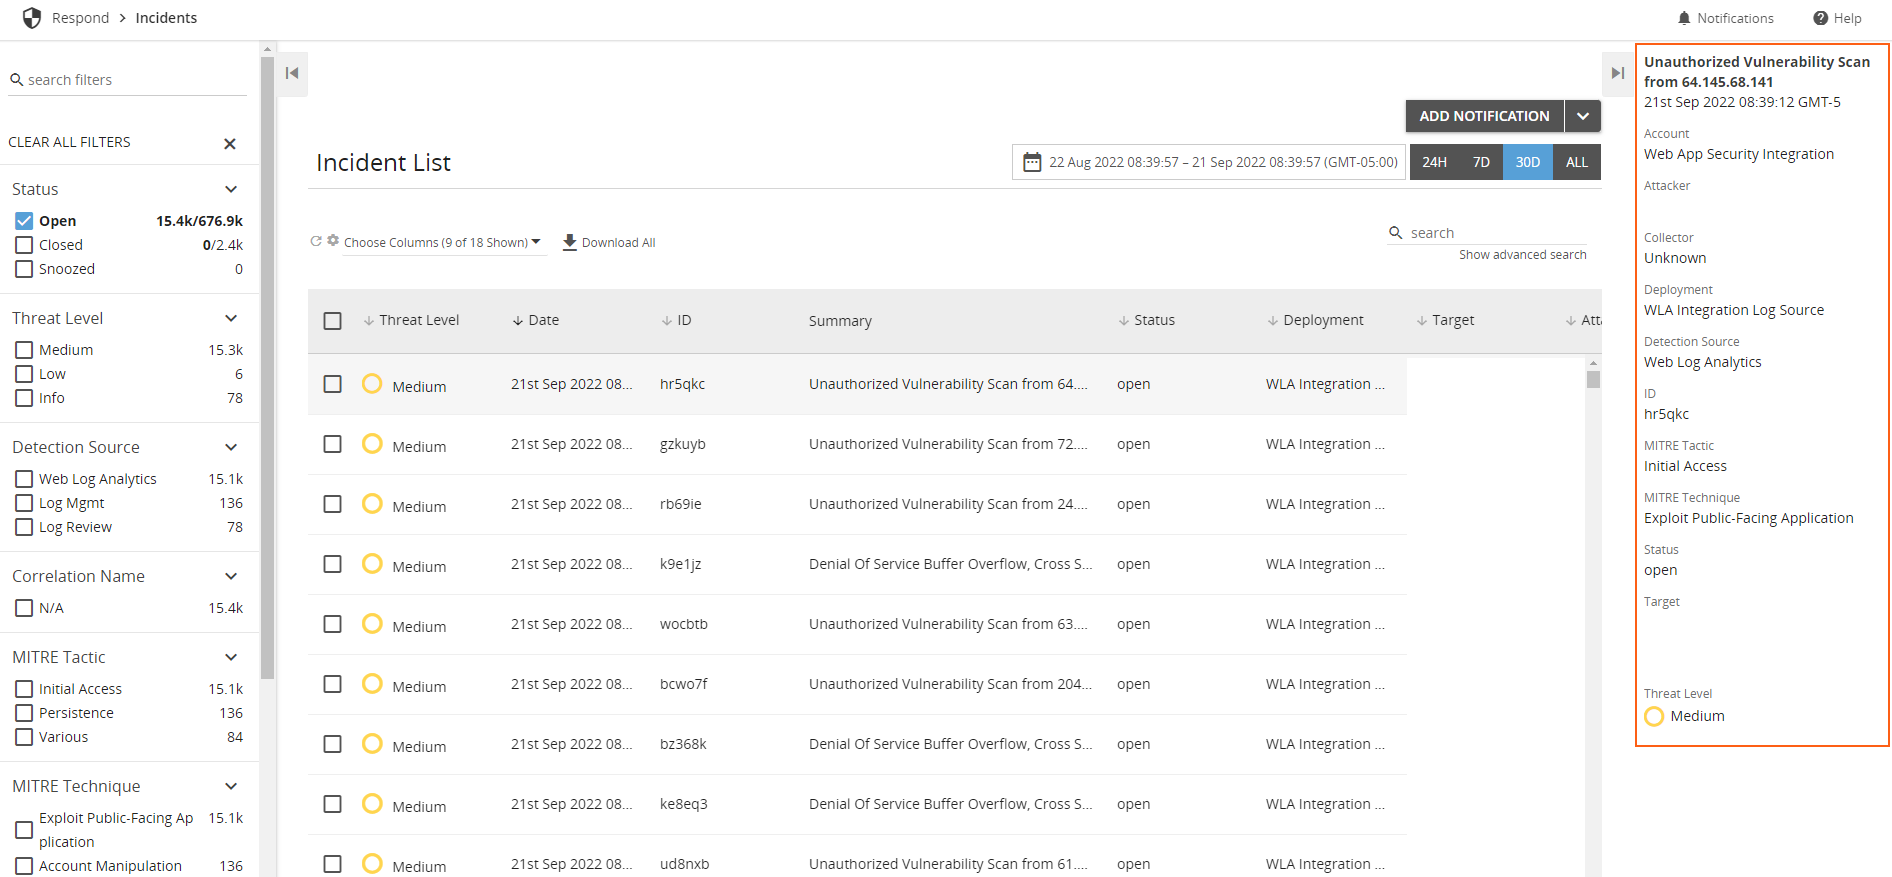
If you are hovering over an incident and do not see the side panel details, open the preview panel by selecting the Show Preview icon (![]() ) in the top right corner.
) in the top right corner.
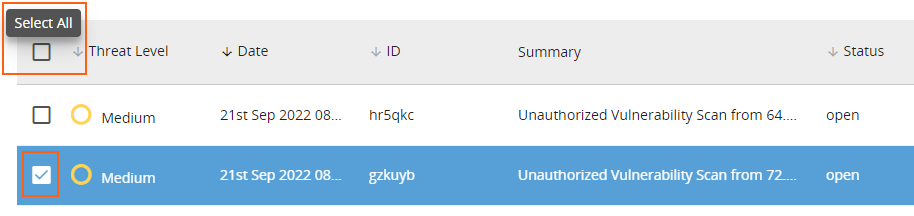
Bulk Actions
Take bulk actions on incidents by checking the boxes to the left of incidents in the Incident List. You can export, update, snooze, and close incidents in bulk. Select as many individual incidents as you like, or check the top box, to the left of of the Threat Level column, to select all incidents on the list.
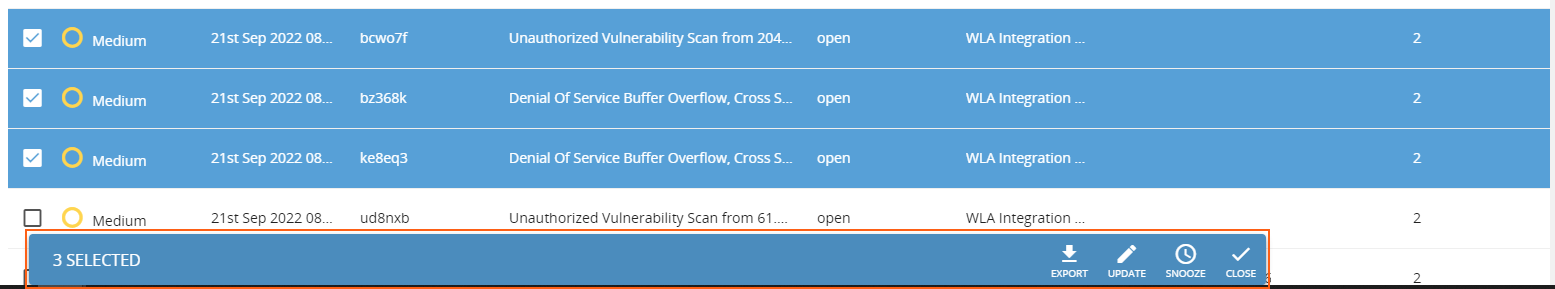
Take action on selected incidents with the blue Selected bar that appears at the bottom of the page with options Export, Update, Snooze, and Close.
Export
Export one or many incidents into a CSV file by checking the incident's box and clicking the Export icon (![]() ) in the blue bar that appears in the bottom right corner of the page.
) in the blue bar that appears in the bottom right corner of the page.
Search
Search through your list of incidents using either the simple search bar or the advanced search feature. Both are located at the top right of the incident list.
Simple Search
To use the simple search, type your search parameters into the text field at the top right of the page and click Enter. Your incident list will filter based on your chosen parameter.
Advanced Search
To use the advanced search feature, click Show advanced search under the search text box. Type a query statement using the available fields and operators and, if necessary, use subsequent search fields to add OR statements and create a search that tests for multiple conditions.
Note: You cannot submit a search with invalid syntax. If invalid syntax is present, a warning icon (![]() ) will appear to the left of the search field.
) will appear to the left of the search field.
For detailed information on performing advanced searches, see the Perform Advanced Search documentation.
Individual Incident
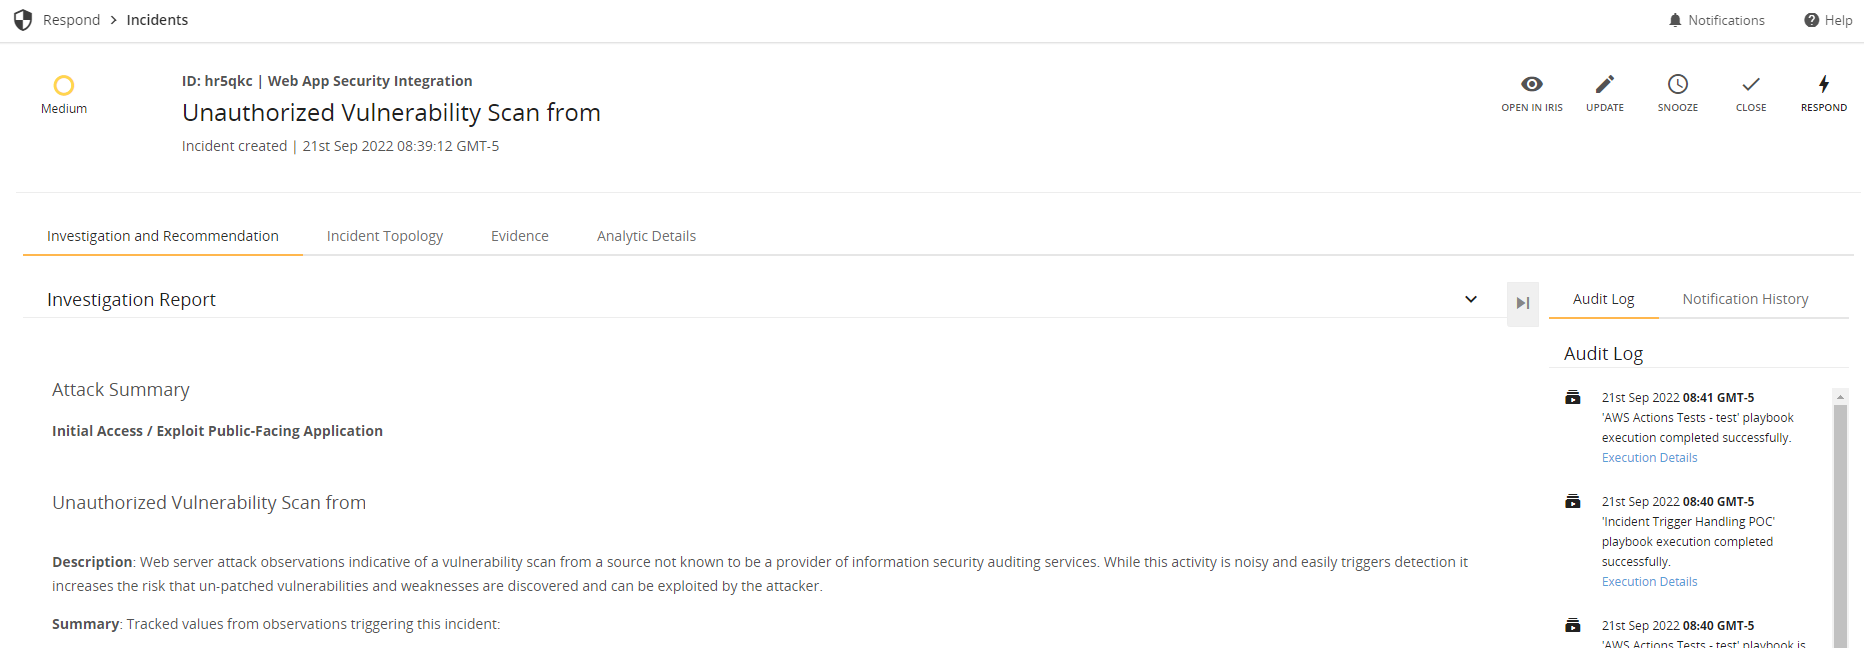
Individual incident pages are dedicated solely to housing all the information on one incident. If the preview on the incident list page did not provide you with enough details to decide on remediation of the incident, exploring its incident page is the next step. This page houses the investigation report, recommendations by Alert Logic analysts, an interactive timeline of evidence, and an audit log on the incident.
Note: If the incident involves assets from AWS environments, you will also see the incident topology tab of your host, deployments, and containers, if applicable.
Features
There are several features available to help you manage your incidents.
Investigation and Recommendation
The Investigation and Recommendation section provides an attack summary, description, and details, as well as an evidence timeline and recommended course of action. Utilize this page to gain a more detailed understanding of the incident.
Audit Log & Notification History
The audit log and notification history widgets are located on the far right of the Investigation and Recommendation page. Click between the two tabs to see each set of information.
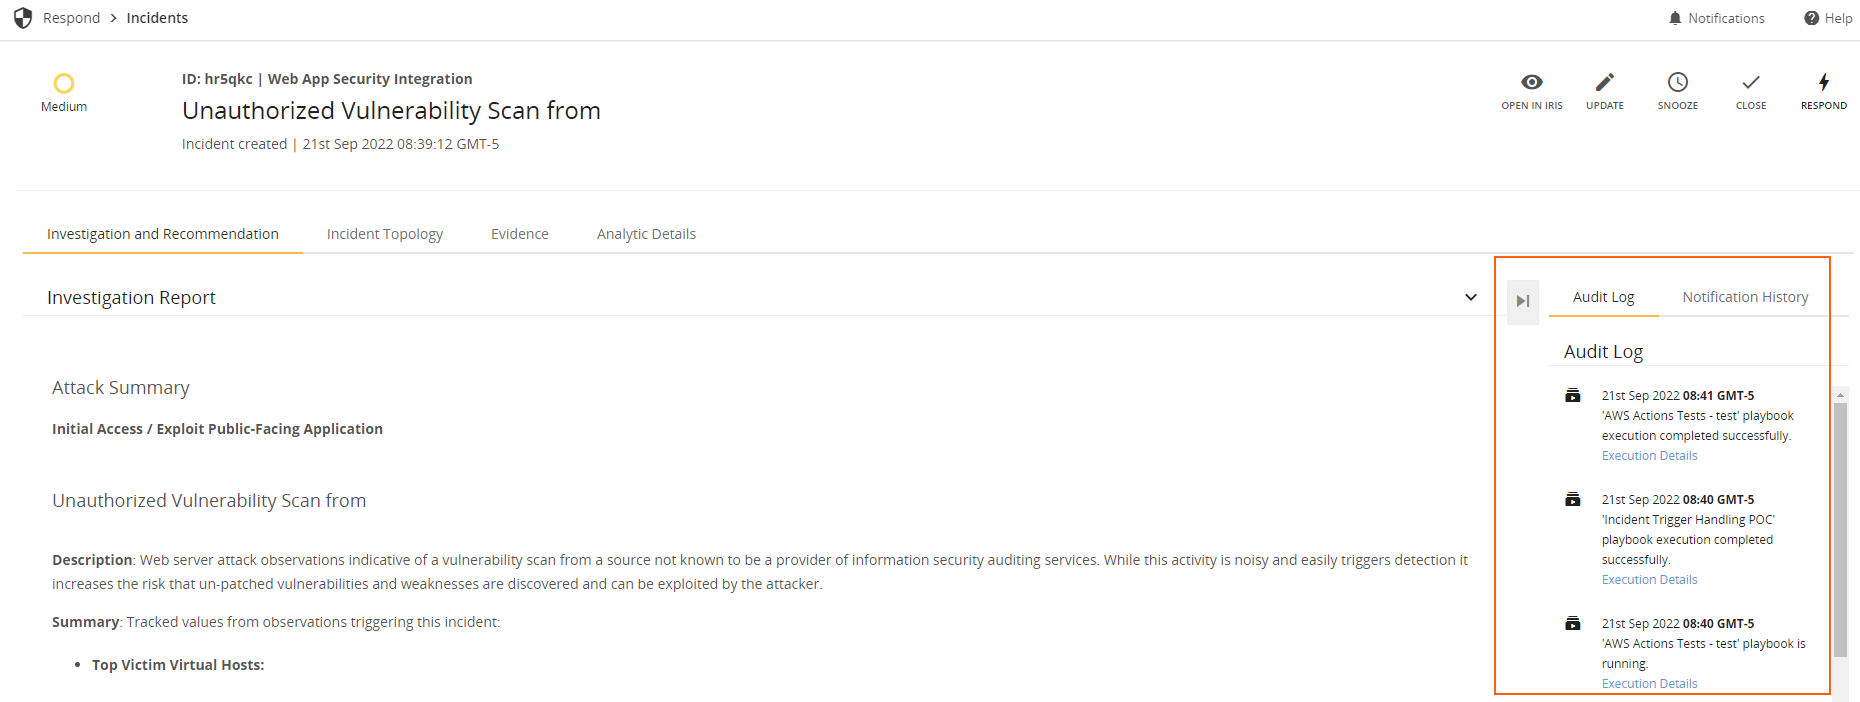
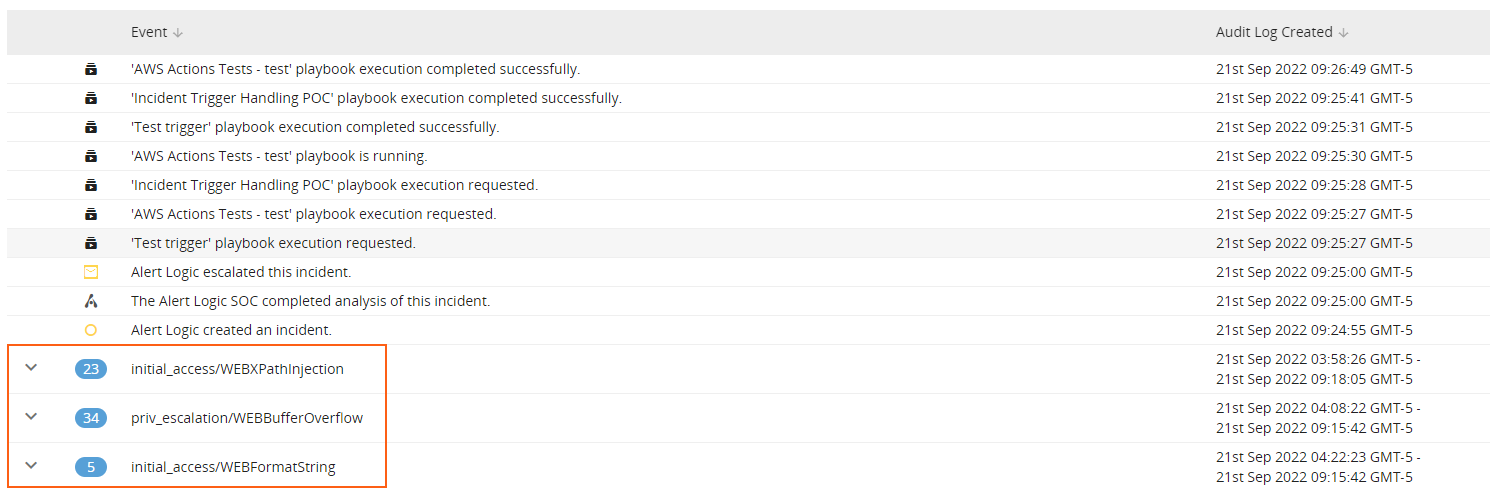
Audit Log
The audit log provides you with an at-a-glance log of all changes to your incident. You can see notes that you have made, as well as flagged events and analyst notes. Quickly access the event details from the flagged events in the audit logs by clicking Execution Details.
Notification History
Notification history provides you with details on the time, method, subject, and recipient of an incident's notification. In order to see the notification history of an incident, you must be subscribed to receive those notifications.
Incident Topology
If your incident was generated from an Amazon Web Services or Microsoft Azure environment whose host Alert Logic has asset information on, you have access to an incident topology view of your host and deployments. If the incident was identified on a container within the cloud environment, you also have access to detailed container metadata.
Click on any hosts or assets in the topology for detail, tag, and relationship metadata.
Evidence
The Evidence page contains a timeline of all notable occurrences regarding the incident. These can include events, new sources, incident audit trails, flagged evidence, and GuardDuty findings if your deployment is in AWS.
Hover over an event, log, or GuardDuty finding within the evidence timeline to review detailed information in the details preview side panel. Event evidence details that appear include event ID, protocol, source and destination IP, source and destination port, and signature. Log details that appear include key log properties and fields.
Within event details, you may also see request and observation information on the initial network request that triggered the event and the network response to it. These sections provide information on network protocol information at different levels, including Frame, Ethernet II, IPV4, TCP, and HTTP. Payload information is also available and can be viewed in HEX and ASCII, or both, and with either Base 63 or URL decoding options, by selecting each option.
Download
Download all events associated with an incident by selecting Download All at the top of the Evidence Event table. You can also download observations by dropping down event data and selecting Download Observations.
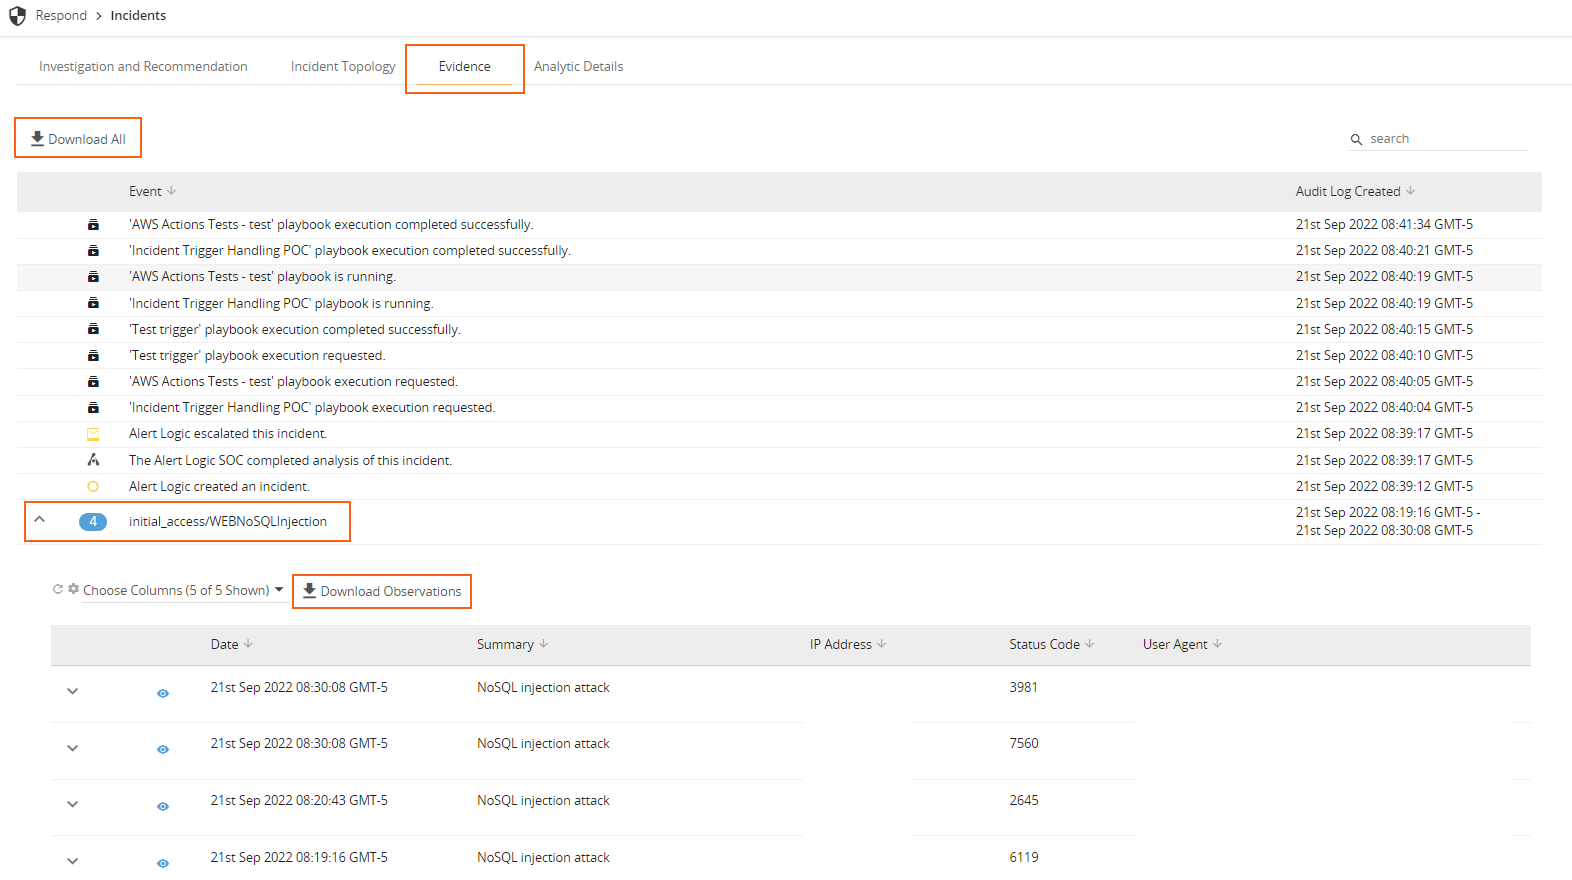
Flagged Events
Flagged events are shown as blue and are specific events or logs within an incident that an Alert Logic analyst found most important for you to be aware of. You can click on the flagged event to see its details, including notes that the analyst has left for you.
Analytic Details
Analytic details include a summary, description, details, and remediation recommendations. Recommendations include any suggested next steps Alert Logic has provided. These suggestions can include both short-term and long-term structural actions to be taken.
Note: Analytic Details is only available to Alert Logic Managed Detection and Response customers.
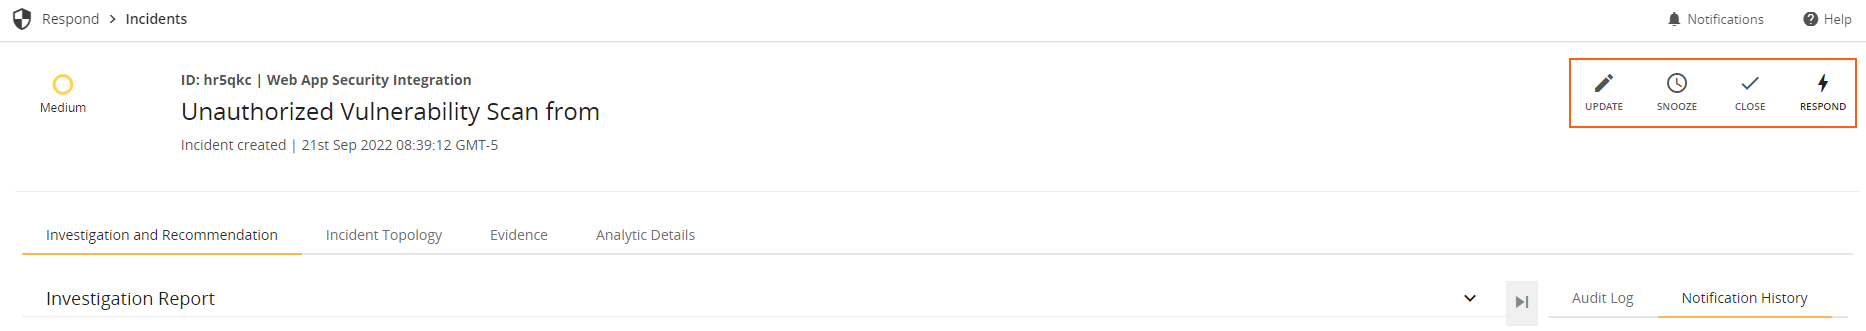
Update, Snooze, Close, or Respond to the Incident
There are several actions you can take for each incident, shown at the top right of the individual incident you are viewing. These include:
- Update – Update allows you to choose from a list of options to update an incident with your assessment of the threat, and to add an optional note about your update. Updates allow others to know the status of the incident and any actions taken. If you update an incident, the incident remains open.
- Snooze – Snooze allows you to temporarily remove an incident from the Incident List until you remediate and close the incident. Select a day to return the incident to the Incident List, and add an optional note about the incident. When you snooze an incident, the icon becomes a green Snoozed icon. Click the Snoozed icon to edit your snooze options, or to cancel the snooze and return the incident to the Incident List.
- Close – Close allows you to select an option that conveys your assessment of the threat and to add an optional note about the incident and the steps taken to close the incident.
- Respond – Respond allows you to automate routine security tasks and responses to threats.
Incident Notification Management
Manage incident notifications in the Alert Logic console via the following pathways for Managed Detection and Response and Legacy Cloud Defender customers, respectively:
- Managed Detection and Response
 > Manage > Notifications > Alert Notifications > filter for Incidents
 - Legacy Cloud Defender
 > Notifications > Alert Notifications > filter for Incidents
Additional Resources
Learn more about incidents and best practices on managing and remediating them with the following Alert Logic knowledge base articles:
Comments
0 comments
Please sign in to leave a comment.