All customers who ingest firewall logs have access to firewall incidents and the related security content via the Incidents page in the Alert Logic console. Firewall dashboards are only available to customers subscribed to Alert Logic Managed Detection & Response who have opted into the new Dashboards console. The types of firewalls supported include:
- Cisco firewall incidents
- Palo Alto firewall incidents
- Fortinet firewall incidents
Firewall Incidents
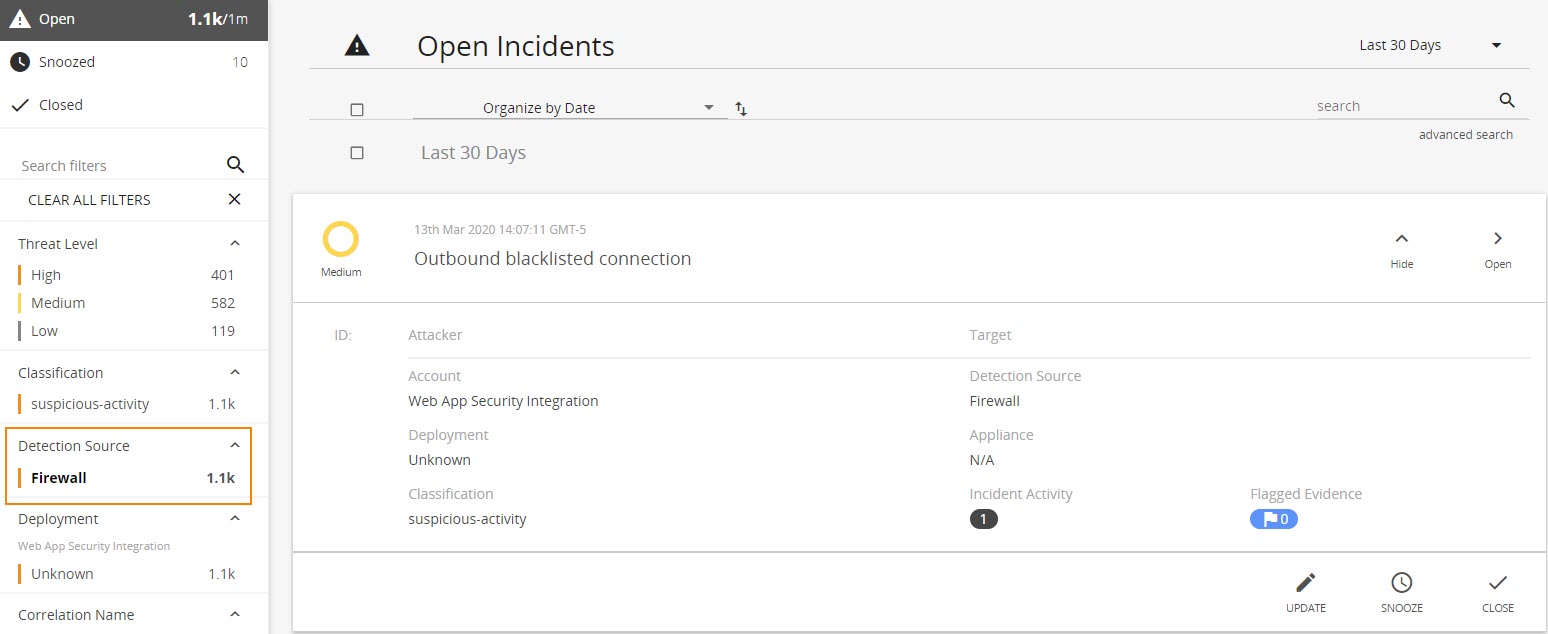
Firewall incidents are available within the Alert Logic console at ![]() (navigation menu) > Respond > Incidents > Detection Source > Firewall. Firewall incidents are automatically escalated to customers; you will receive an email notification to review and manage these incidents in the Alert Logic console when they are detected.
(navigation menu) > Respond > Incidents > Detection Source > Firewall. Firewall incidents are automatically escalated to customers; you will receive an email notification to review and manage these incidents in the Alert Logic console when they are detected.
As with other incidents, you can preview the metadata available for a firewall incident by clicking Preview. Here, you can update, snooze, or close the incident. If you need more information before managing the incident, click Open to view an investigation report, recommendations for remediation, and evidence.
Firewall Dashboards
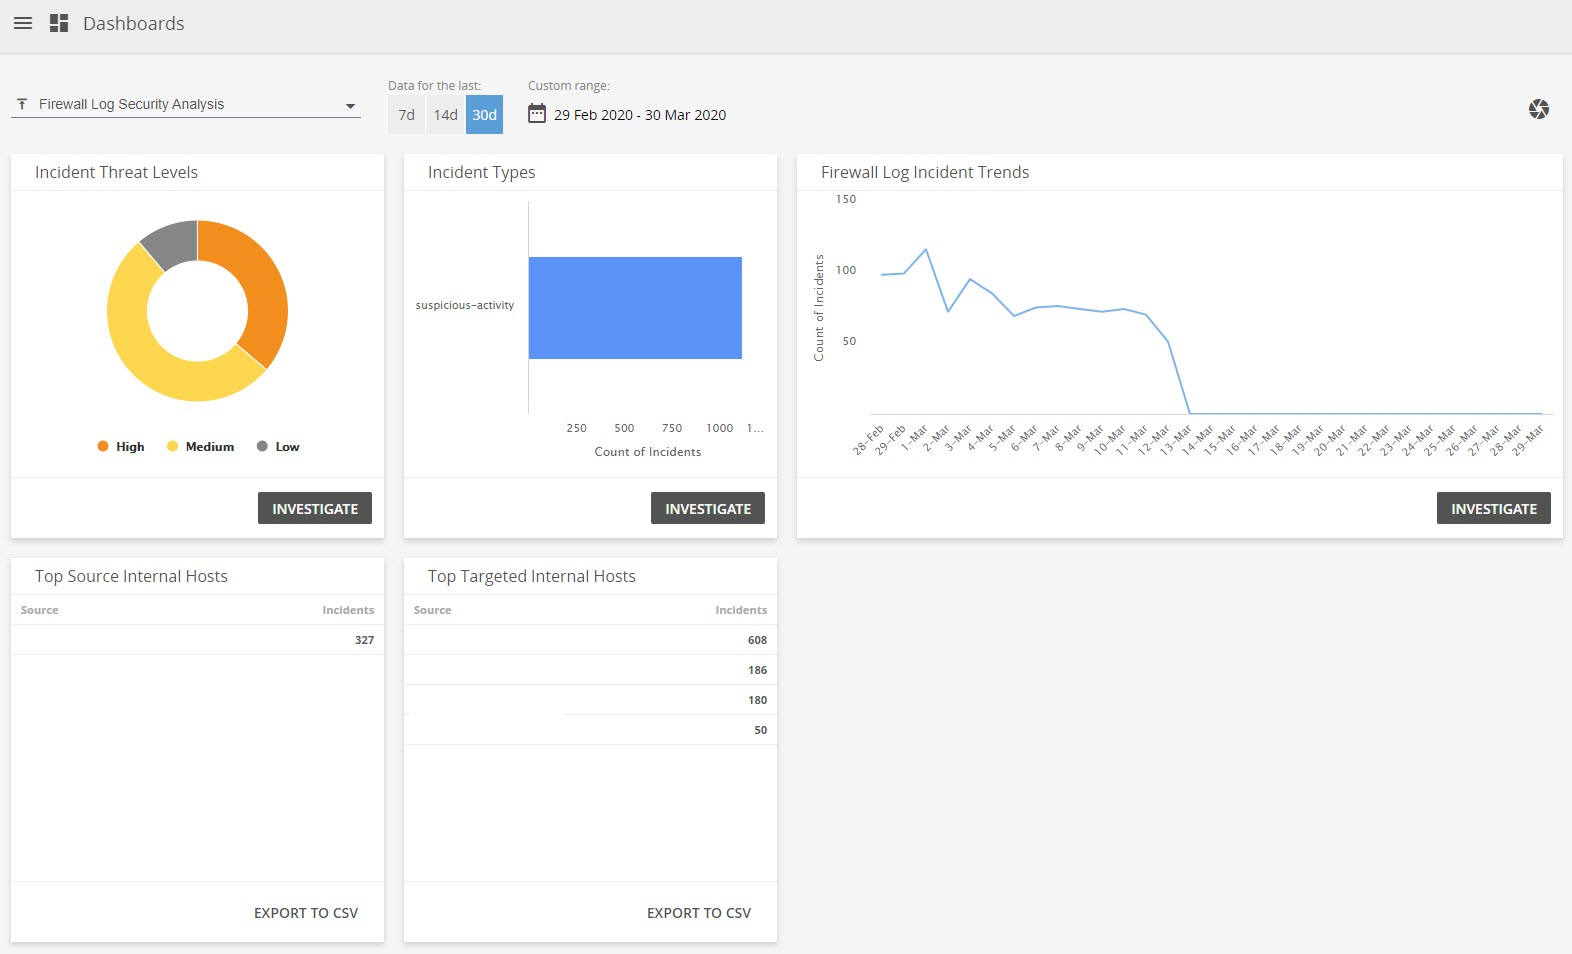
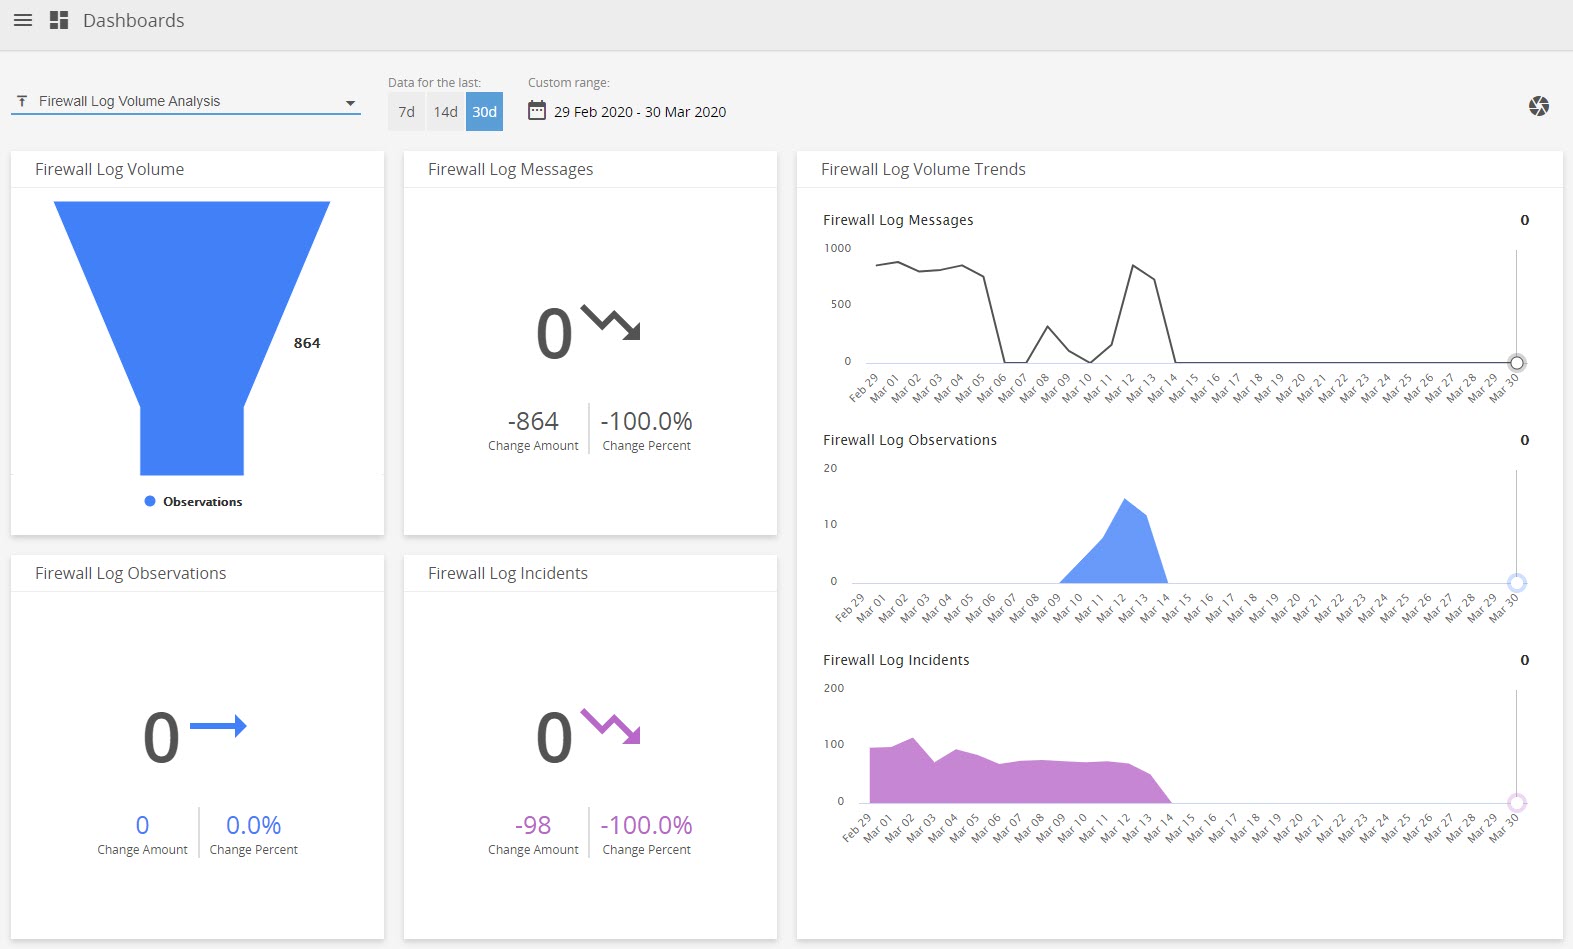
Two firewall dashboards are available for Managed Detection & Response customers within the Dashboard page of the Alert Logic console—Firewall Log Security Analysis and Firewall Log Volume Analysis. These dashboards provide at-a-glance security content around firewall logs that are being ingested by Alert Logic.
Firewall Log Security Analysis Dashboard
The Firewall Log Security Analysis dashboard provides insights into the recent firewall security incidents generated in your environment. Use this dashboard to view detected incidents, analyze the effectiveness of your current firewall incident response efforts, and learn about emerging threats. Security content such as Incident Threat Levels and Firewall Log Incident Trends are available here, and you can easily drill down to more detailed information via the Investigate button or export data to CSV.
Firewall Log Volume Analysis Dashboard
The Firewall Log Volume Analysis dashboard provides an analysis of the volume of firewall security incidents and observations in your environment. Use this dashboard to quickly identify patterns, trends, and anomalies that require immediate response or further investigations. Security content such as Firewall Log Message and Firewall Log Incidents are available here. Data is color-coded—gray refers to firewall log messages, blue refers to firewall log observations, and purple refers to firewall log incidents.
For more information, see the Firewall Incidents documentation.


Comments
0 comments
Please sign in to leave a comment.