The Dashboards page, found in the navigation menu (![]() ), serves as the Alert Logic console homepage and houses several sets of interactive graphics. The dashboards visualize your environment's data and cover the following information:
), serves as the Alert Logic console homepage and houses several sets of interactive graphics. The dashboards visualize your environment's data and cover the following information:
- Threat Summary
- Email Summary
- Vulnerability Summary
- Automated Response Summary
- Coverage and Health
- TRI Summary
- Endpoint Protection
- File Integrity Monitoring
- Firewall Log Traffic Analysis
- Firewall Log Volume Analysis
- Authentication Management Summary
- Authentication Management Security
- Web Log Analytics
- Firewall Log Security Analysis
Also on this page, you can change the color mode of the dashboards with the color icon (![]() ) in the top right-hand corner.
) in the top right-hand corner.
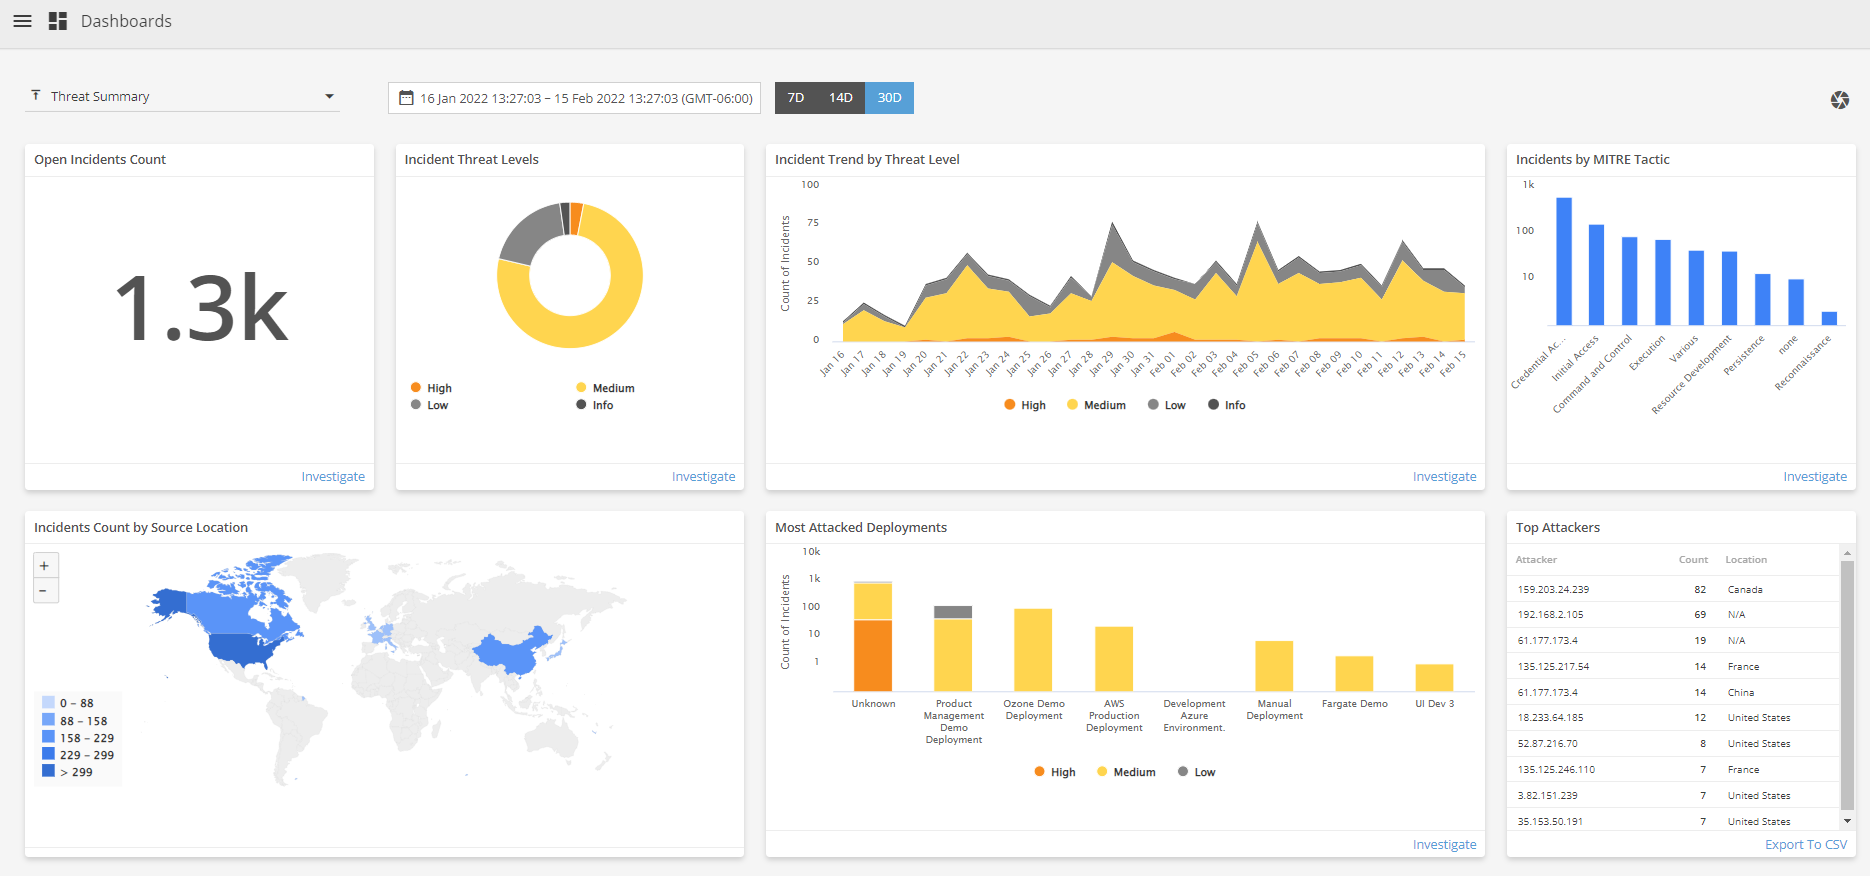
Threat Summary
The Threat Summary dashboard provides graphical information on incidents, including data points such as Open Incident Count, Incidents Count by Source Location, Incidents by MITRE Tactic, and Top Attackers.
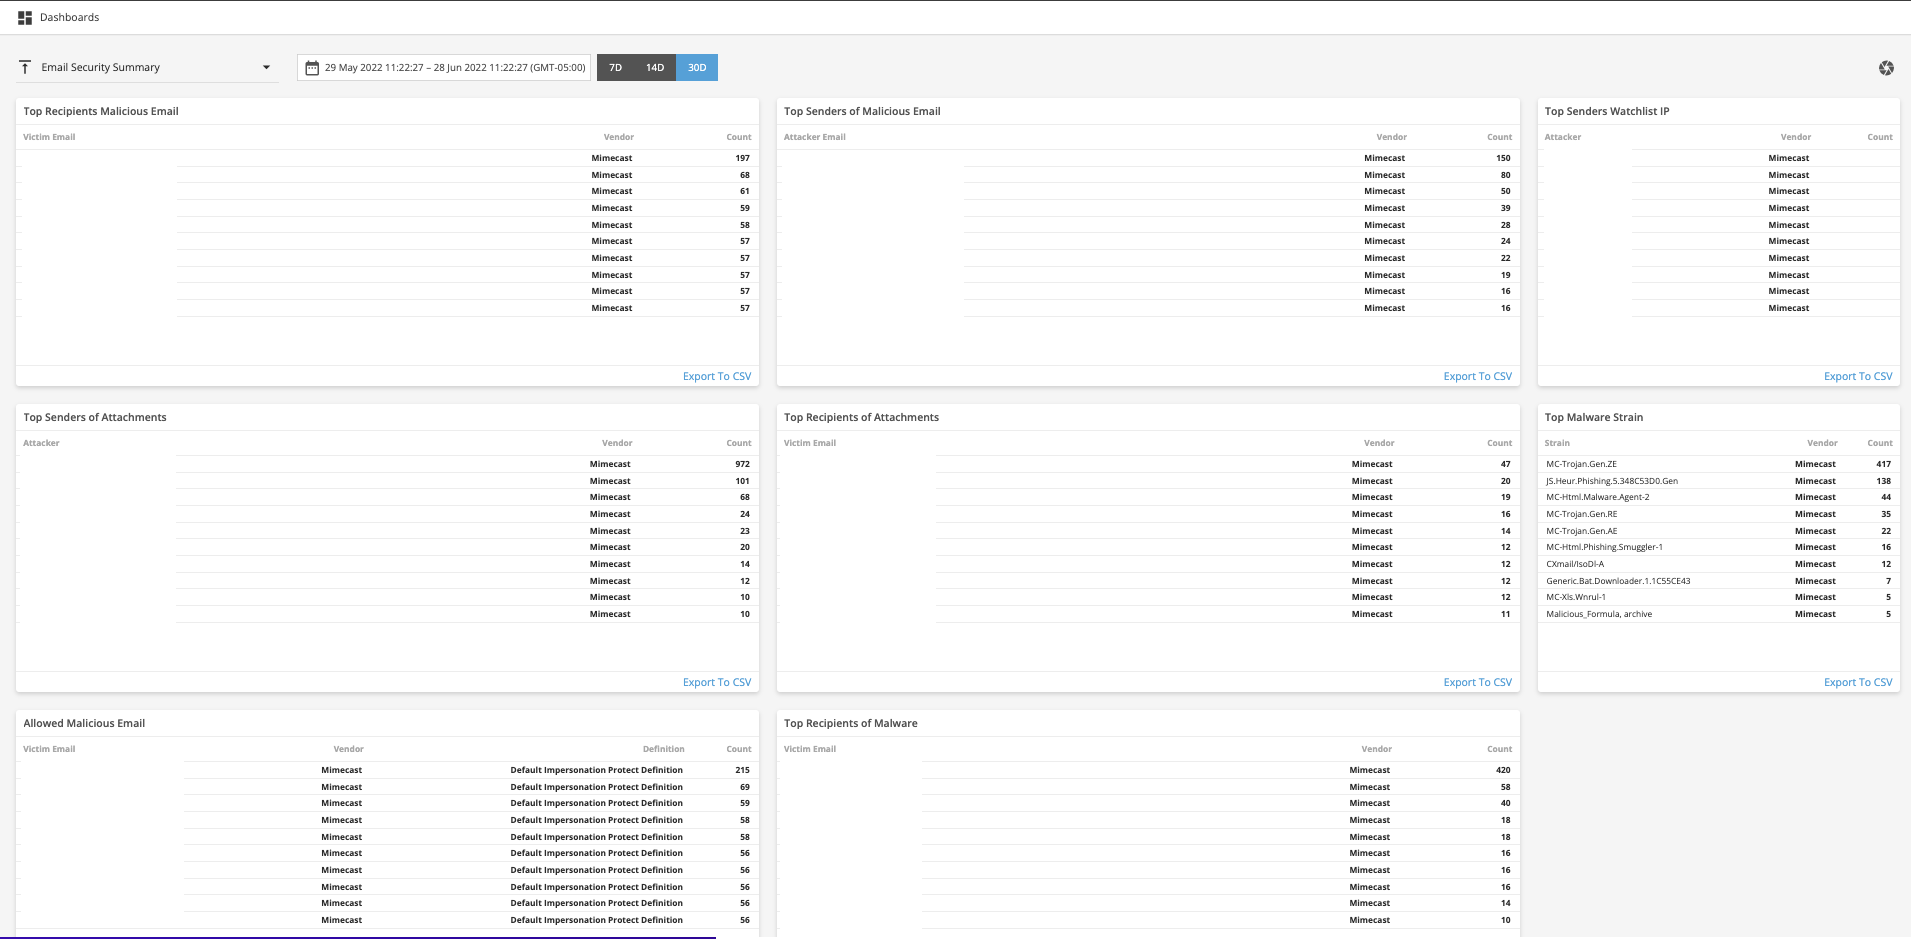
Email Security Summary
The Email Security Summary dashboard provides a real-time view of the current state of top Mimecast analytics and alerts. This dashboard also allows you to capture lists of top offenders and victims of email-based threats in a single-page view. Some data points include Top Senders of Malicious Email and Top Malware Stain. This dashboard will appear for customers when collected data feeds into it.
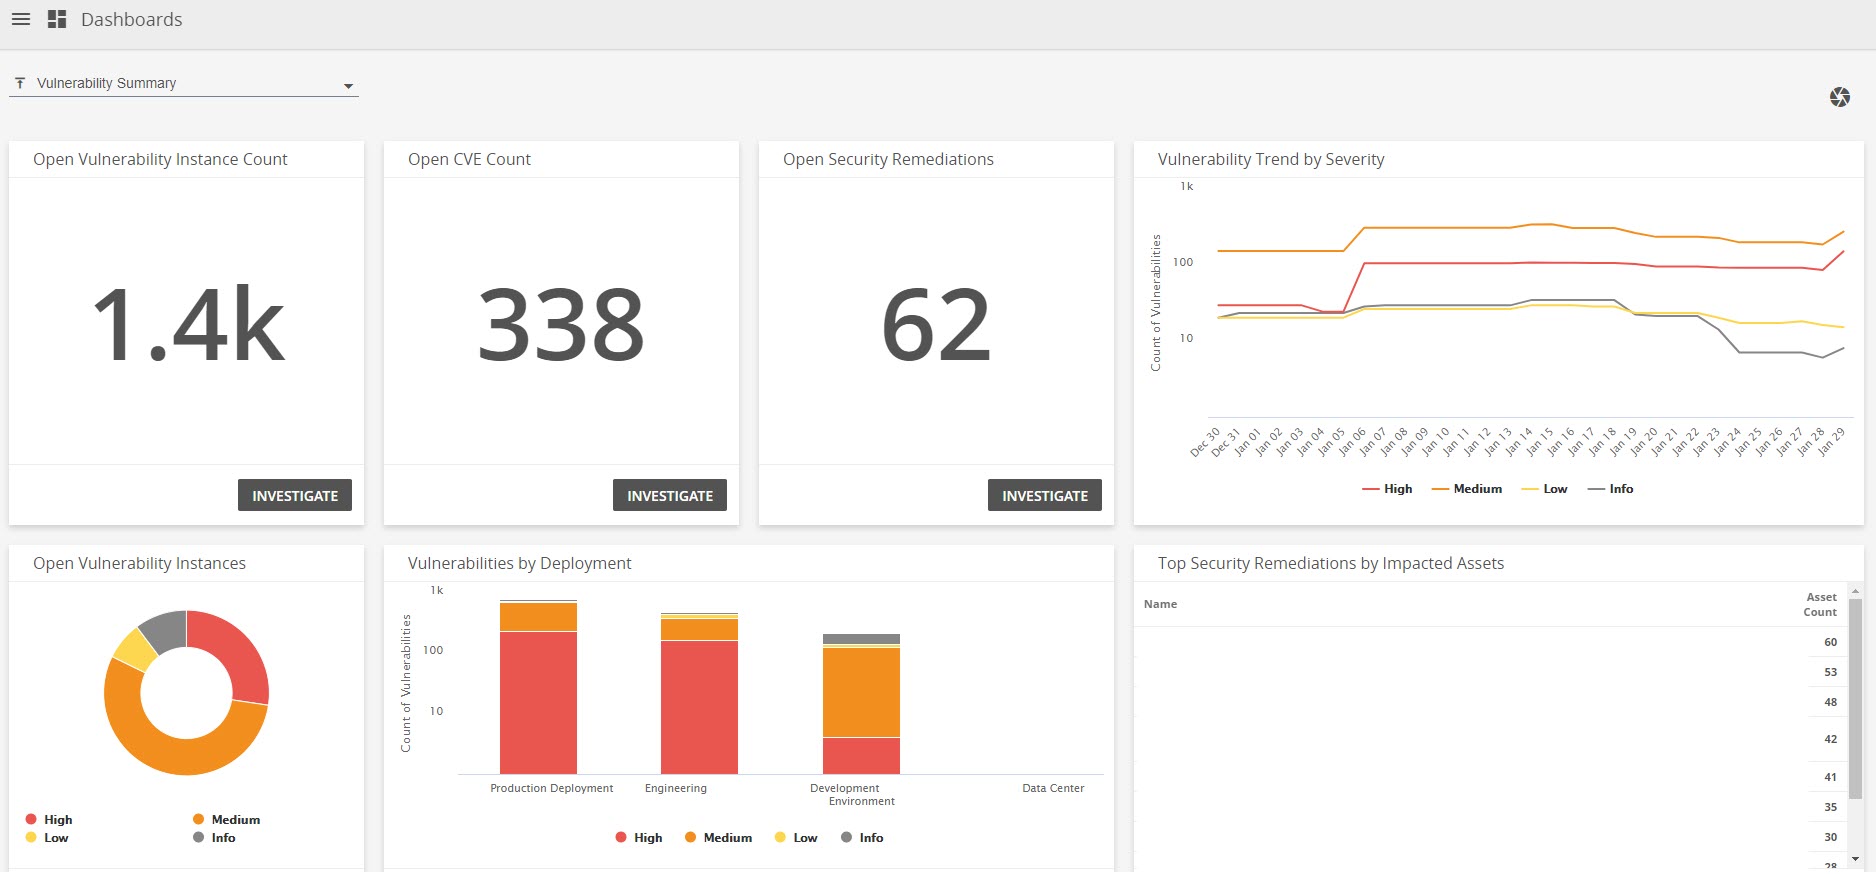
Vulnerability Summary
The Vulnerability Summary dashboard provides graphical information on scanning and confirmation assessments, including data points such as Vulnerabilities by Deployment and Most Vulnerable Hosts.
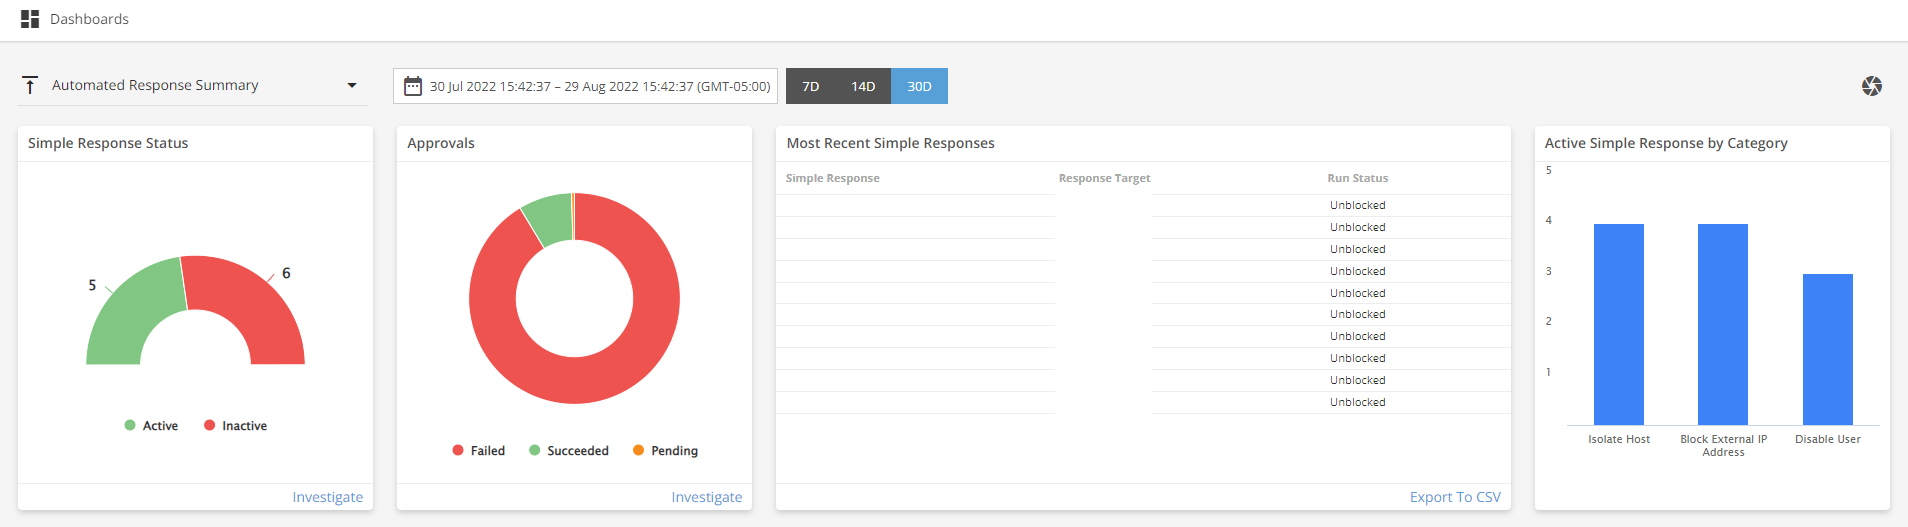
Automated Response Summary
The Automated Response Summary dashboard provides graphical information on Simple Responses created with Automated Response and includes data points such as Most Recent Simple Responses and Simple Response Status.
Coverage and Health
The Coverage and Health dashboard provides graphical information on general account health including your network, appliances, agents, other assets, and entitlement usage and includes data points such as Protected Network Status and Unprotected Node Count.

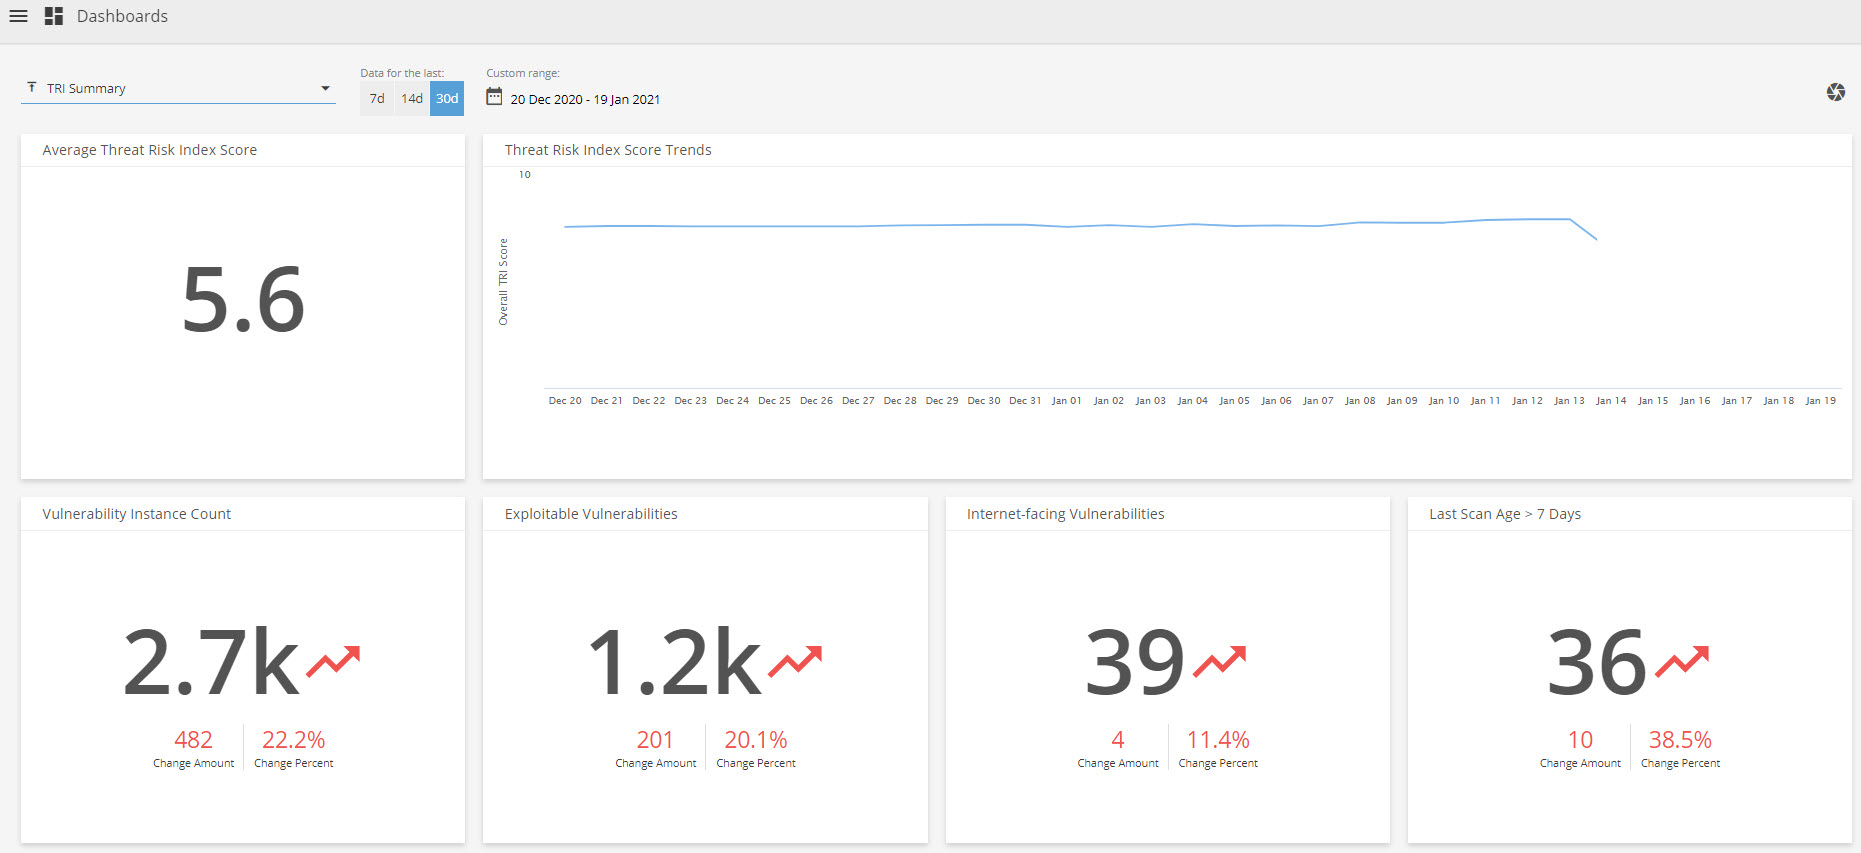
TRI Summary
The TRI Summary dashboard provides graphical information on recent Threat Risk Index (TRI) scores of your environment including the average TRI score and trends, vulnerability changes, last scanned asset changes, and TRI scores by assets and includes data points such as Total Vulnerabilities and Deployments by TRI Score.
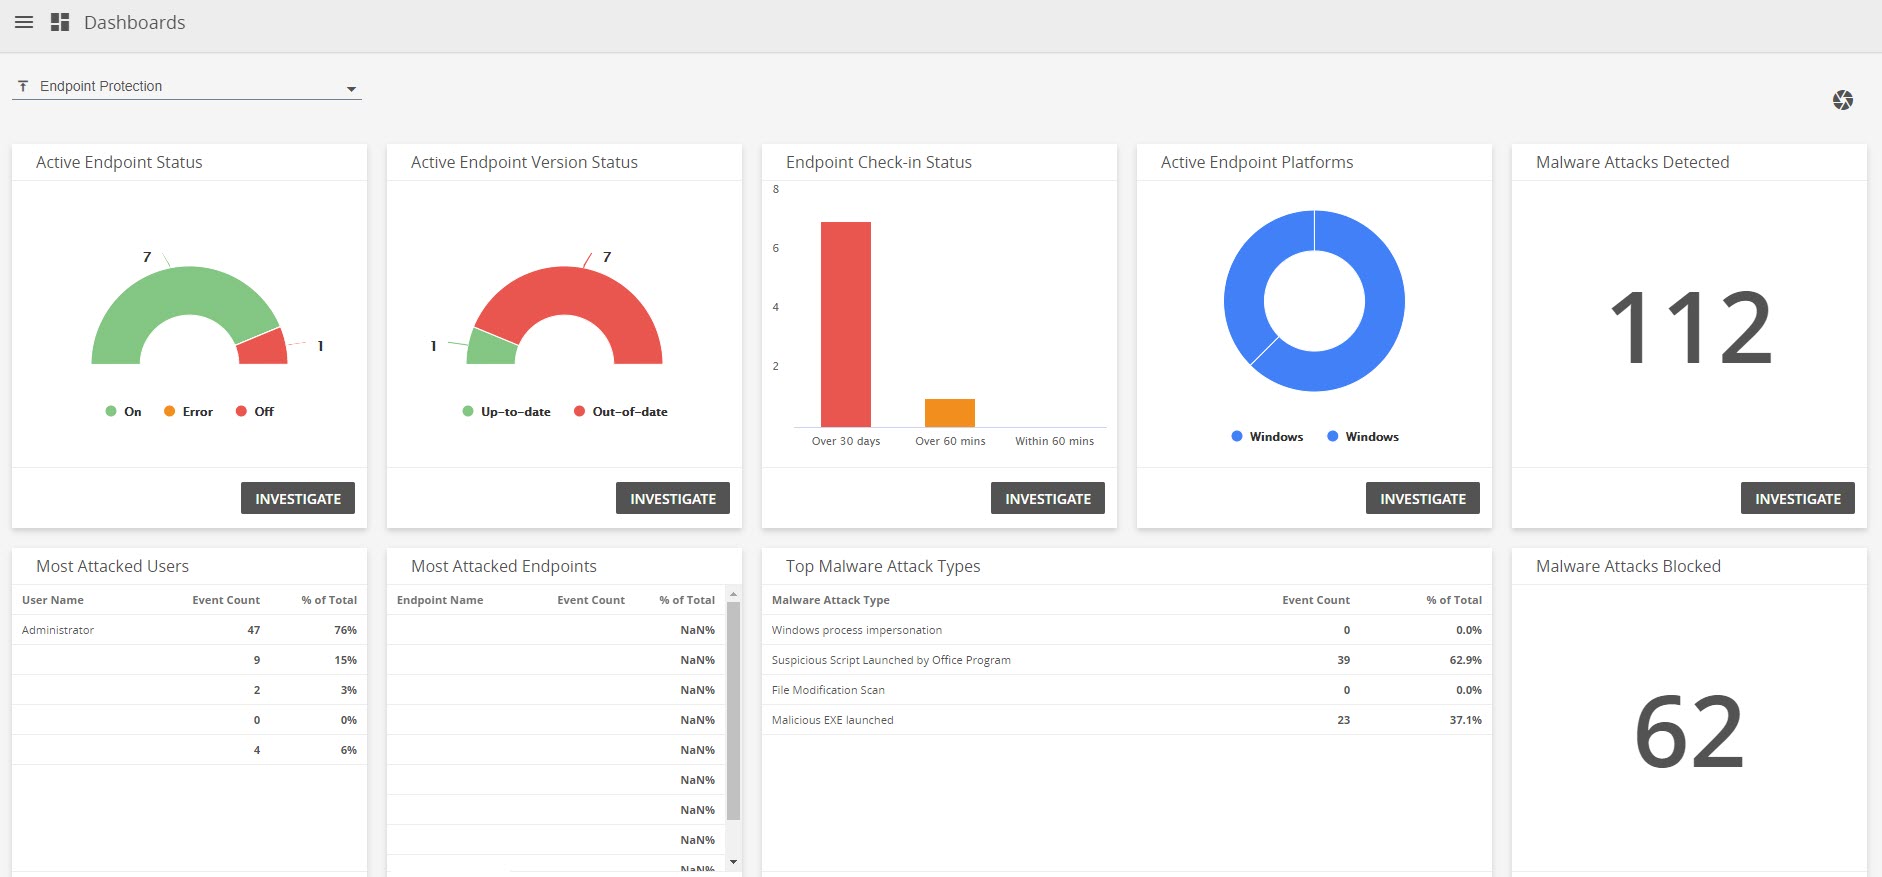
Endpoint Protection
The Endpoint Protection dashboard provides graphical information on endpoint and includes data such as Malware Attacks Detected, Most Attacked Endpoints, and Malware Attacks Blocked.
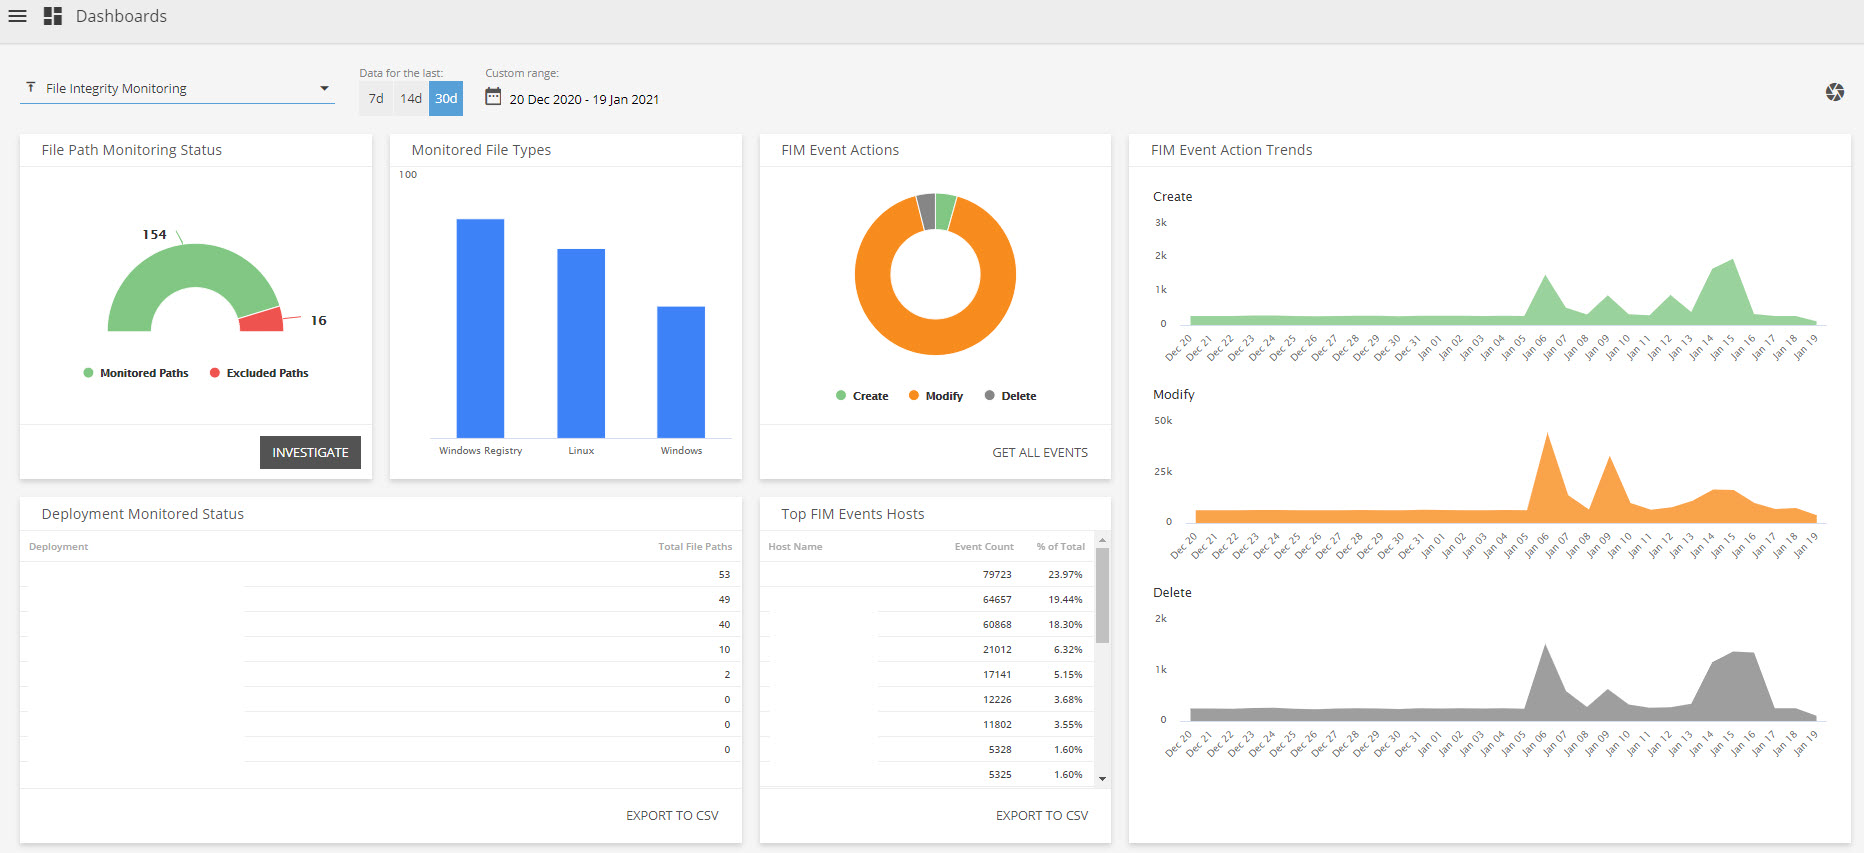
File Integrity Monitoring
The File Integrity Monitoring dashboard provides graphical information on your file integrity monitoring activity and issues found in your environment and allows you to gain insights into your file monitoring scope and status, focus your resources on specific systems or users that may need further investigation, and identify patterns or anomalies in your environment. This dashboard includes data such as Monitored File Types and TOP FIM Events Hosts.
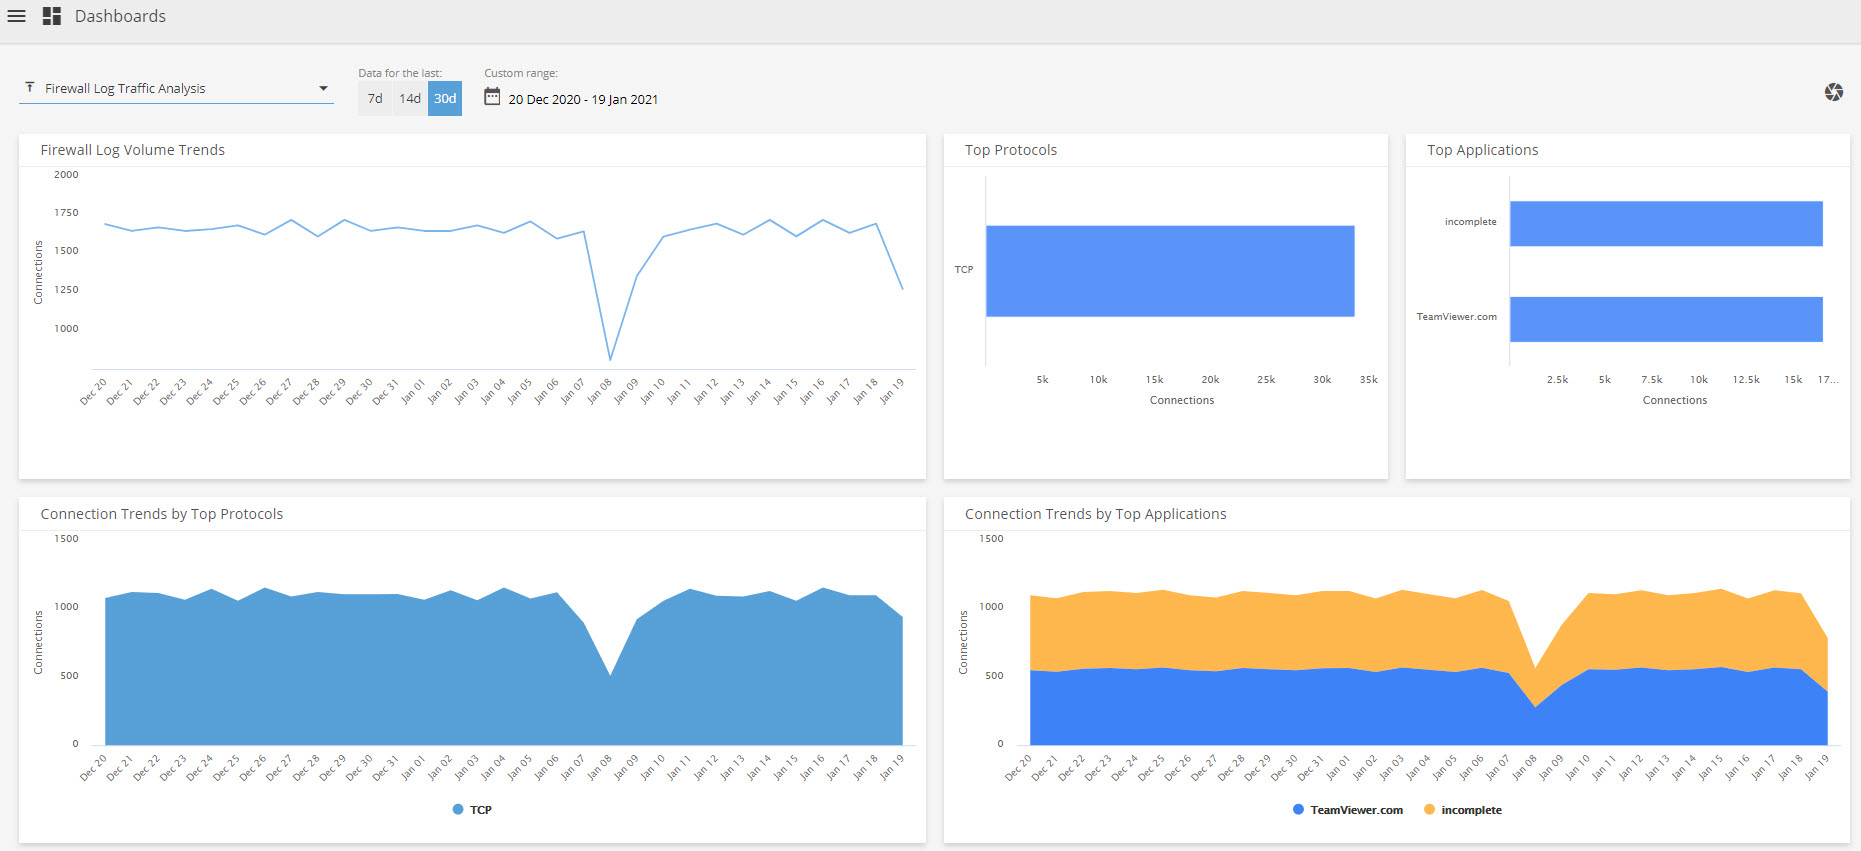
Firewall Log Traffic Analysis
The Firewall Log Traffic Analysis dashboard provides graphical information on the firewall traffic connections found from analyzing firewall logs in your environment and allows you to identify the types of connections detected, trends that require further investigation, and learn about emerging threats. This dashboard includes data such as Connection Trends by Top Protocol and Top Applications.
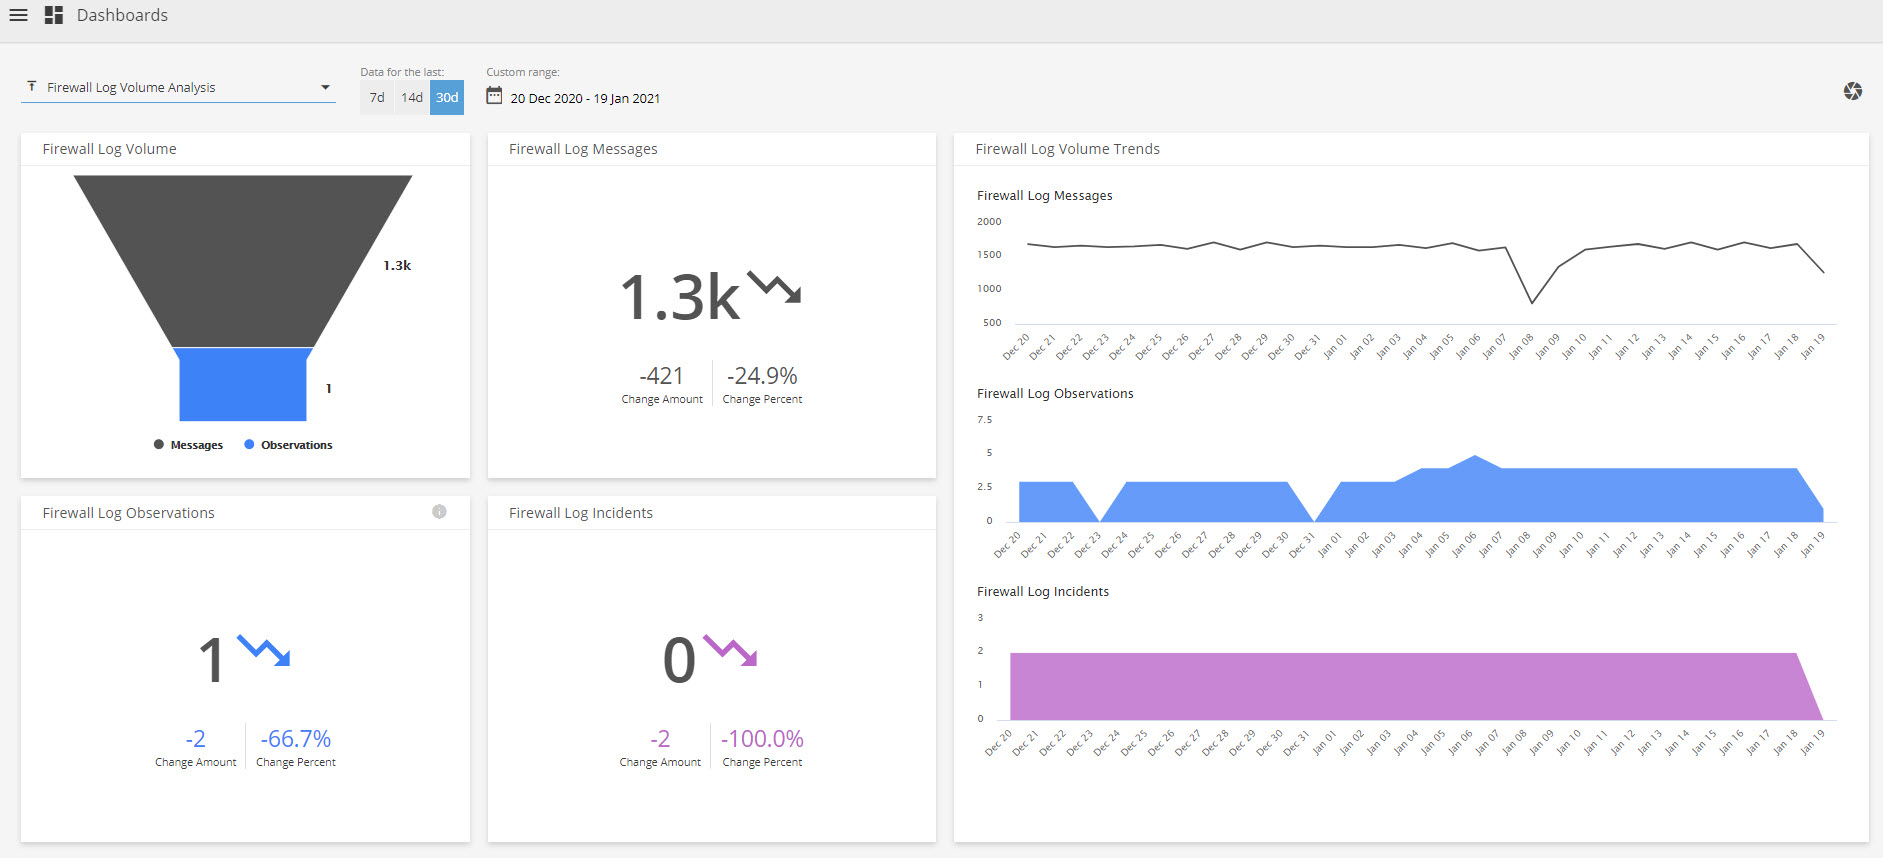
Firewall Log Volume Analysis
The Firewall Log Volume Analysis dashboard provides graphical information on the volume of firewall log messages and firewall security incidents and observations in your environment and allows you to quickly identify patterns, trends, and anomalies that may require response or investigation. This dashboard includes data such as Firewall Log Volume Trends and Firewall Log Incidents.
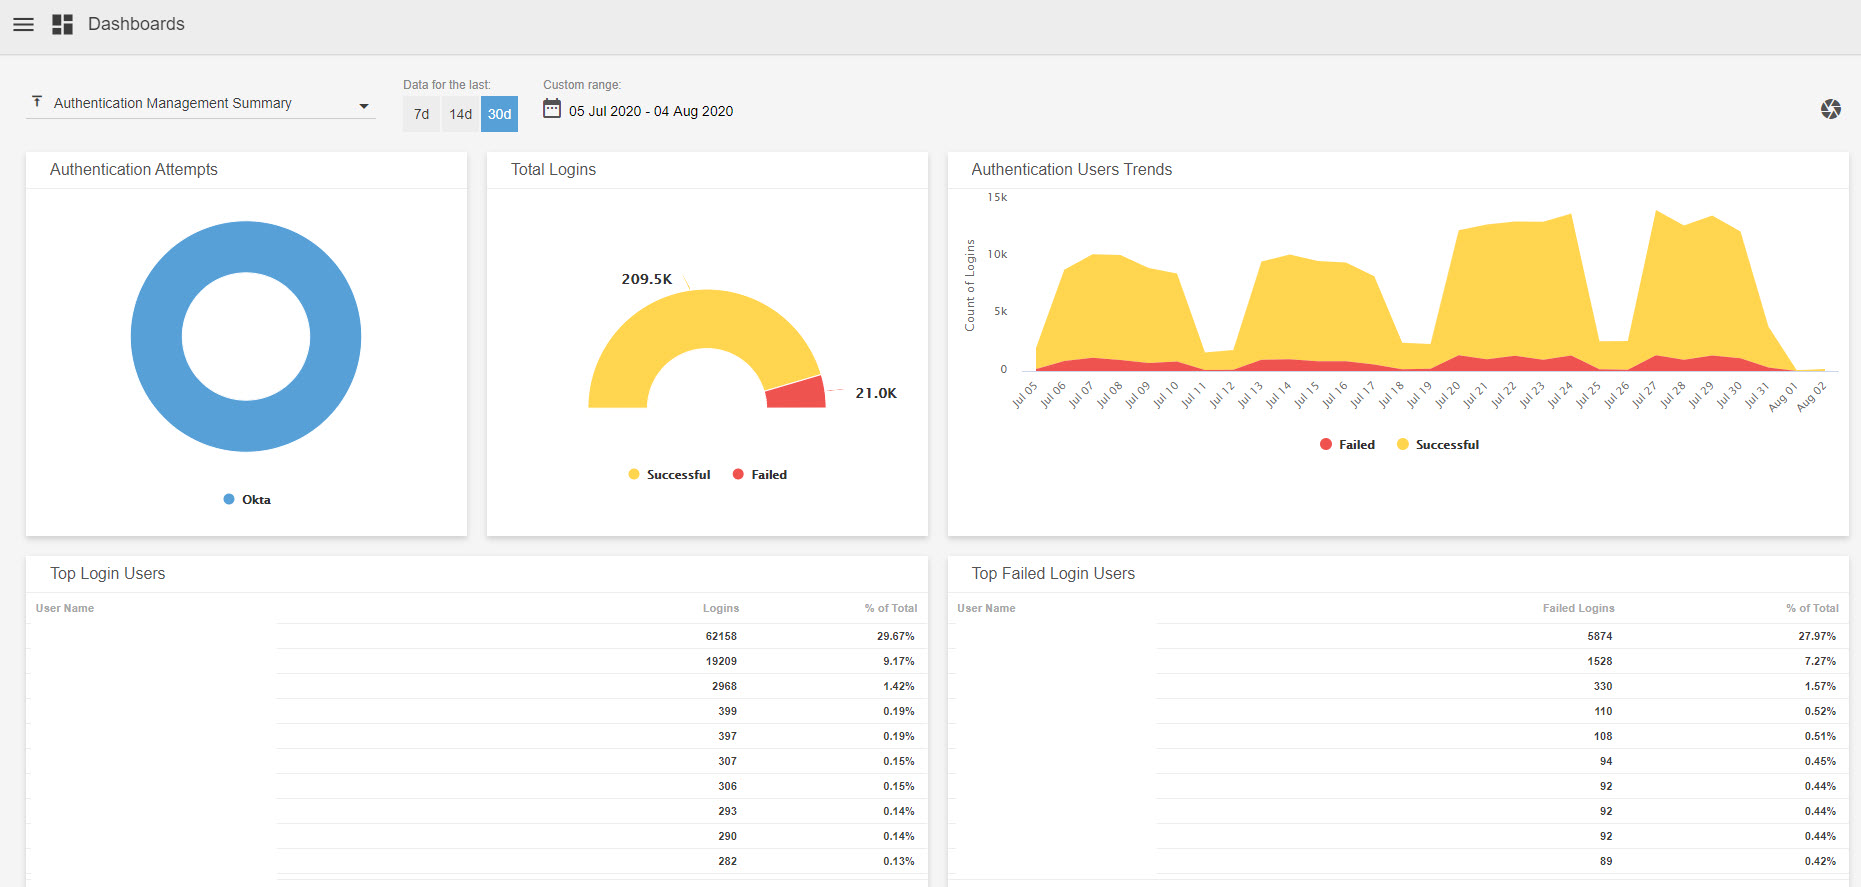
Authentication Management Summary
The Authentication Management Summary dashboard provides graphical information on the authentication management application login activities observed in your environment and will allow you to gain insight into your management efforts and ultimately focus your resources on threats in your environment. This dashboard includes data such as Authentication Attempts and Top Login Users.
Authentication Management Security
The Authentication Management Security dashboard provides graphical information on the authentication security activity in your environment and allows you to gain insights into your user authentication attempts and login activity in your environment. This dashboard includes data such as Incident Classifications and Top Sign-In Attempts from Risky IP.
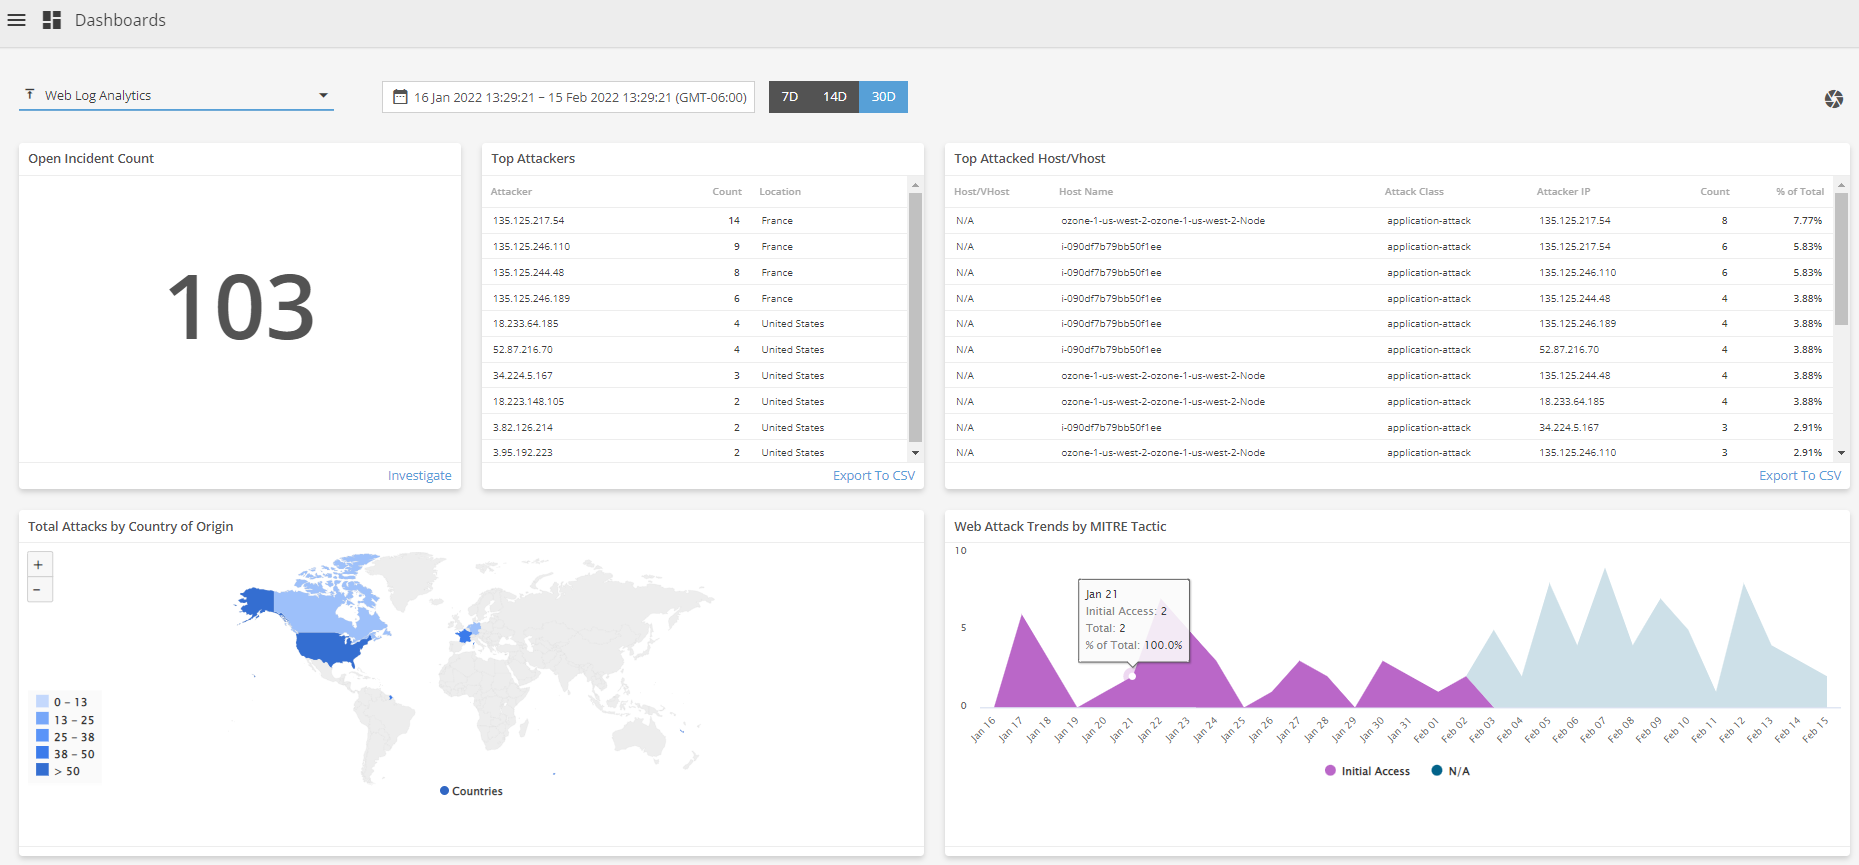
Web Log Analytics
The Web Log Analytics dashboard provides graphical information on the threats, incidents, and observations detected from your web log analytics instance in your environment and allows you to gain insights into the types of incidents detected in your environment, analyze the effectiveness of your current incident response efforts, and learn about emerging threats. This dashboard includes data such as Top Attackers and Web Attack Trends by MITRE Tactic.
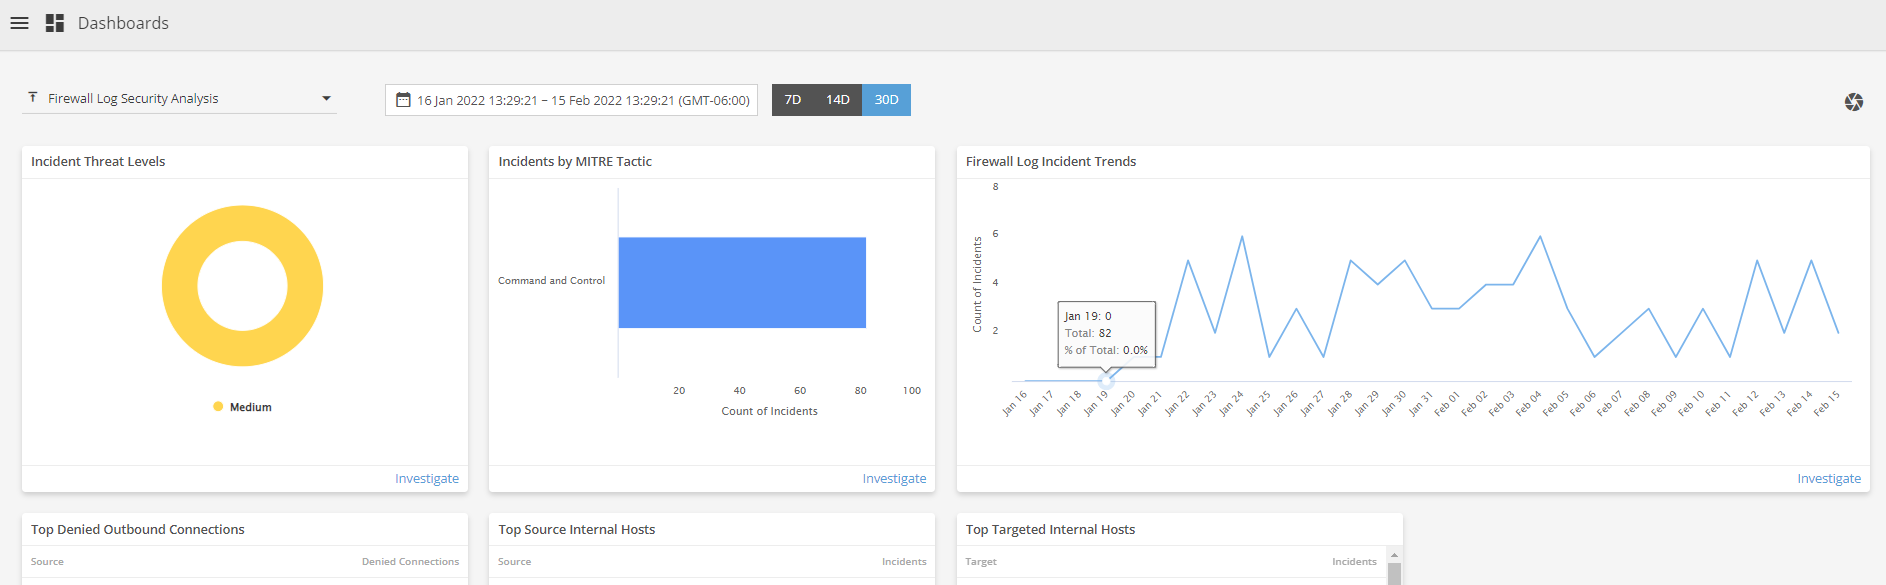
Firewall Log Security Analysis
The Firewall Log Security Analysis dashboard provides graphical information on the firewall security incidents generated from analyzing firewall logs in your environment and allows you to quickly identify the types of firewall incidents detected, analyze the effectiveness of your current firewall incident response efforts, and learn about emerging threats. This dashboard includes data such as Firewall Log Incident Trends, Incidents by MITRE Tactic, and Top Targeted Internal Hosts.
Comments
0 comments
Please sign in to leave a comment.